
Orchestrator Notification Service
Monitoring Alarms
The recommended method for monitoring real-time alarms via Orchestrator is to use the remote log receivers. Orchestrator provides a Notification Service that allows clients to subscribe for an aggregated stream of alarms that includes both appliance-level alarms for the entire SD-WAN fabric as well as alarms generated by Orchestrator itself. Collectively, this unified alarm stream can be subscribed for using a number of different transport protocols:
- Kafka
- Syslog
- HTTP/HTTPS
- Websockets
For each of these options, either alarms can be streamed, or the audit log on Orchestrator can be streamed. Each method also provides support for tracking alarm sequence IDs, which are unique per remote log receiver, and for requesting any specific alarms based on sequence ID.

How to Add a Remote Log receiver for Websocket
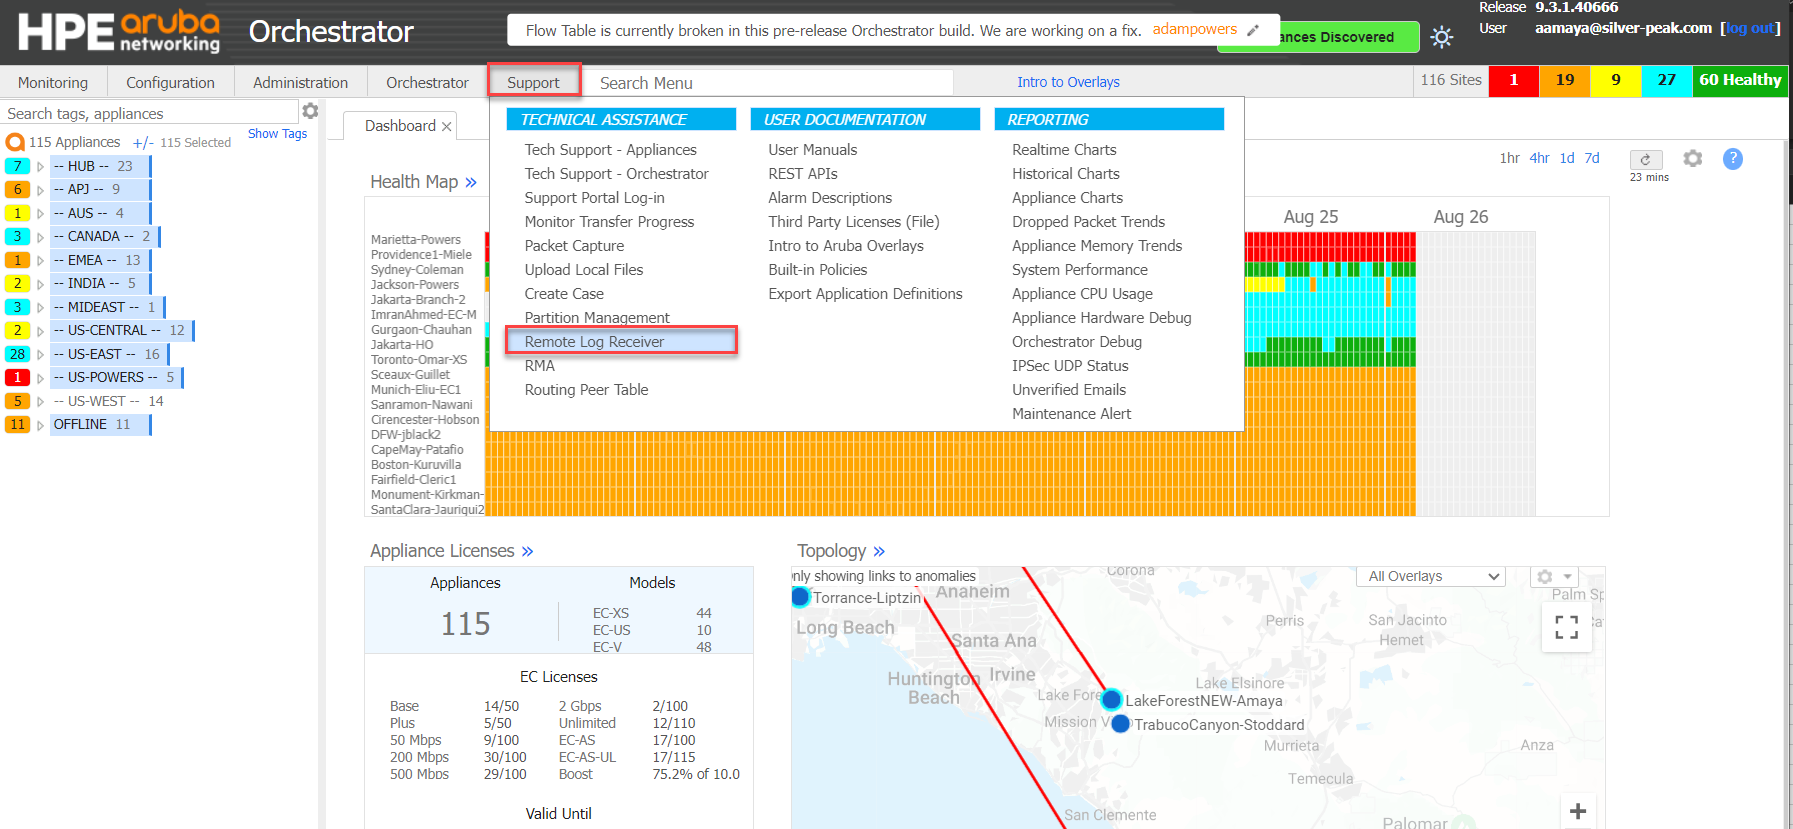
- In Orchestrator > Go to Support > Technical Assistance > Remote Log Receivers
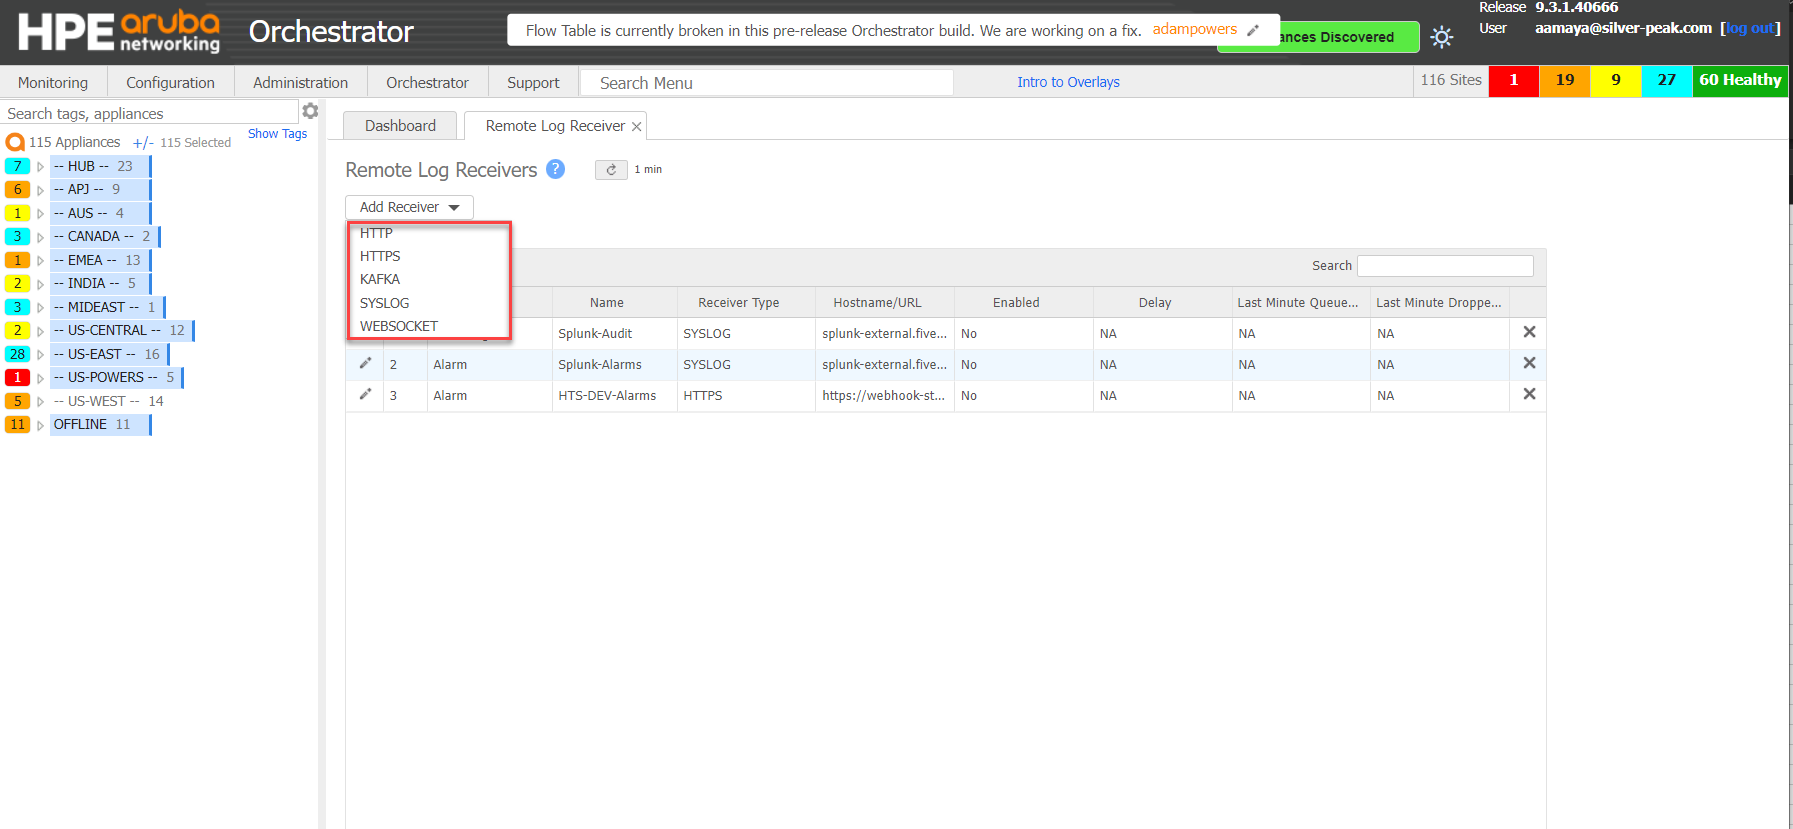
- Select Add Receiver and select Websocket
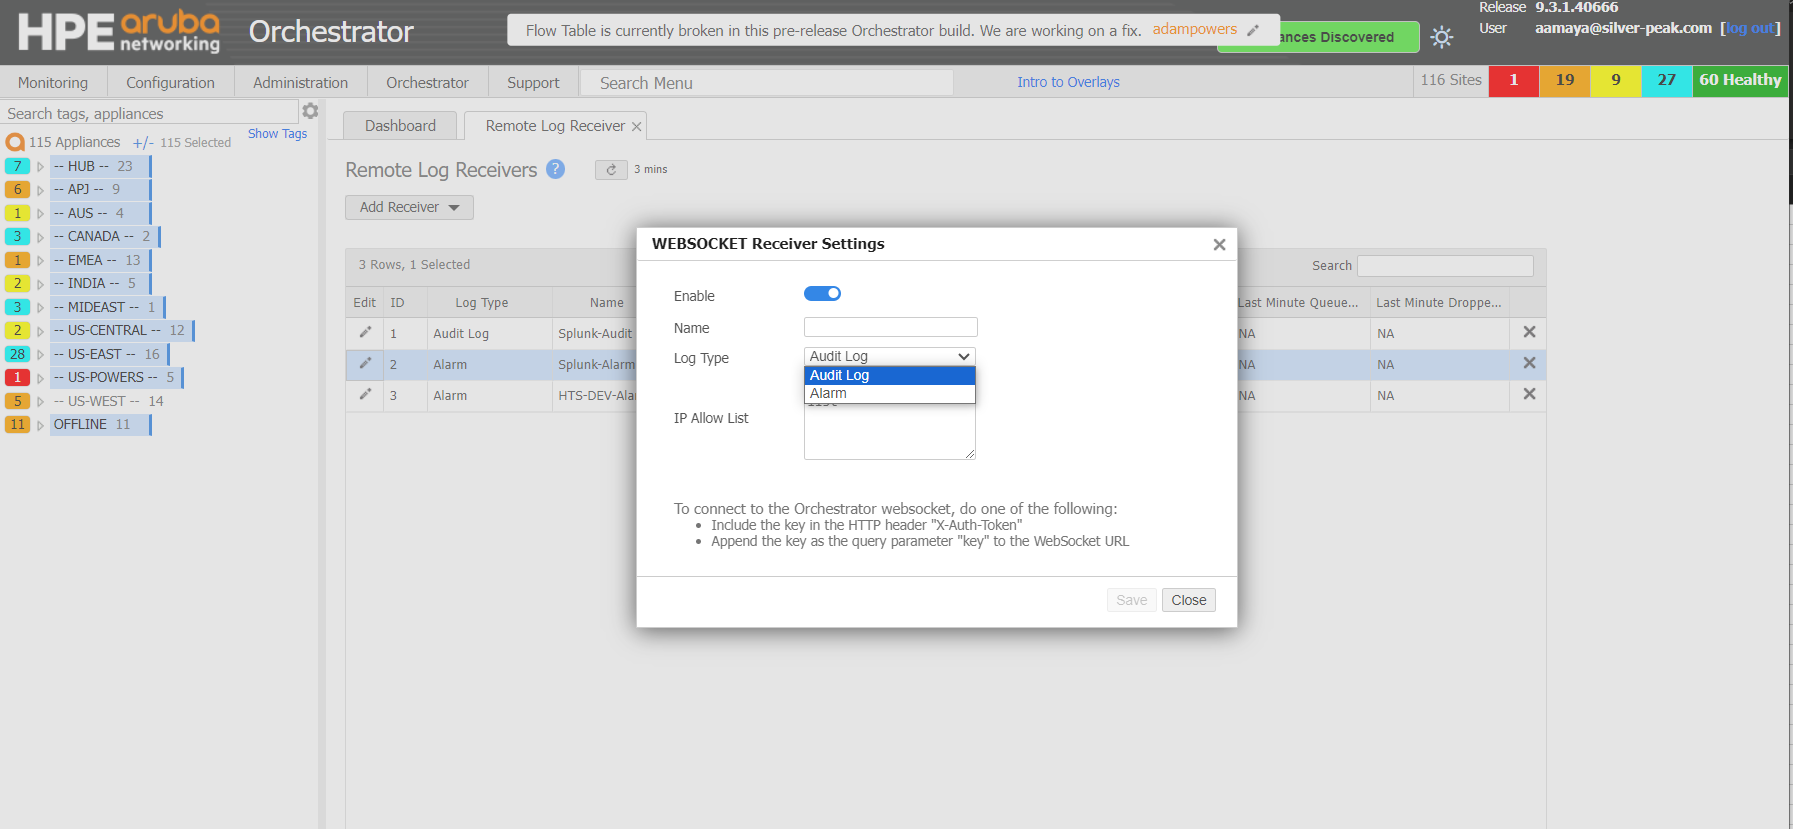
 3. Enable the Receiver, provide a name, select the Log type and provide a list of source IP addresses that are allowed Websocet access to Orchestrator
Alarm Representation
With all Orchestrator notification Services, a standard schema is used for representing alarms, as shown below:
{
sequenceId: 1066,
timestamp: '2020-01-23T18:30:13Z',
hostname: 'Xus-MacBook-Pro.local',
appName: 'ALARM',
severity: 'WARNING',
msgId: 262189,
data: {
clearable: true,
acknowledged: false,
perceivedSeverity: 'WARNING',
alarmCategory: '',
source: 'Ping for sp-ipsla.silverpeak.cloud,8.8.8.8,8.8.4.4 on Port wan0 label INET1',
systemId: '0.NE',
systemHostname: 'ecvc',
alarmId: 281,
raisedTime: 1579804213000,
clearedTime: 0,
description: 'An IP SLA monitor is in the Down state',
recommendedAction: 'An IP SLA monitor has reported Down status. Please check and correct the source of the failure.',
closed: false
},
message: 'WARNING|Ping for sp-ipsla.silverpeak.cloud,8.8.8.8,8.8.4.4 on Port wan0 label INET1|An IP SLA monitor is in the Down state||1066|2020-01-23T18:30:13Z||||ecvc'
}
Updated over 1 year ago