
Best Practices: Capacity Management for Link Utilization
EdgeConnect Link Utilization using Orchestrator and ECOS REST APIs
To monitor the link utilization of EdgeConnect gateways we can do it in two ways. We can use the aggregate stats from the Orchestrator, or we can use the minute stats from the ECOS Rest APIs.
To begin we are assuming we have an Orchestrator and EdgeConnect appliances deployed. First we need to login into the Orchestrator to use the Swagger application. The Orchestrator performs the administrative tasks to manage and configure the Edgeconnect gateways. The Orchestrator has its own set of Rest APIs and the ECOS gateway has its own set of Rest APIs. In the document, we will cover both set APIs to monitor the link utilization and show examples.
To login to the Orchestrator there are several options but the recommendation is to create an API user and create an API key for the API user. There are examples provided in the HPE Aruba Networking Developer Hub for creating an API key and they can be accessed here API key examples. As for the EdgeConnect gateways you will need to login to each one individually to initiate the session, collect the data, then close the session.
Once logged in we can get an inventory of the EdgeConnect appliances deployed. To do this we can use the GET /appliances endpoint from the Orchestrator to get the appliances ID. The appliance ID is to be used later to pull the data from Orchestrator and the ECOS API endpoints. Notice the response body example below showing "id": "1.NE" for hostName SanFranSP01. We will use the id which is the nePk for the EdgeConnect gateway. We will use the nePK with the Rest API endpoints for both Orchestrator and ECOS. Lets proceed with the Orchestrator Rest API endpoint.
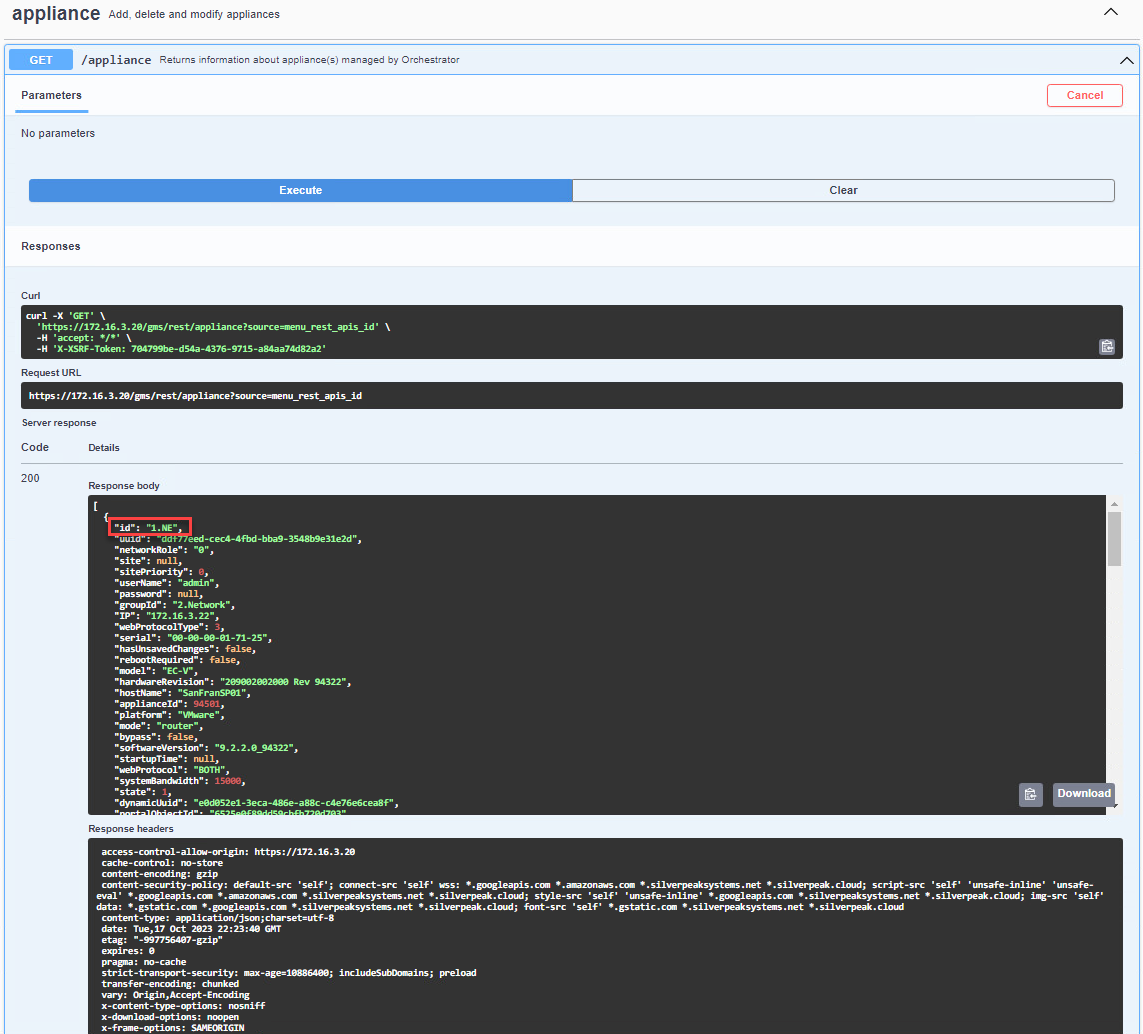
GET /appliance from swagger and in red it highlights the appliance id
Orchestrator Rest API endpoint /stats/aggregate/interface
The Orchestrator Rest API endpoint to use is the /stats/aggregate/interface.
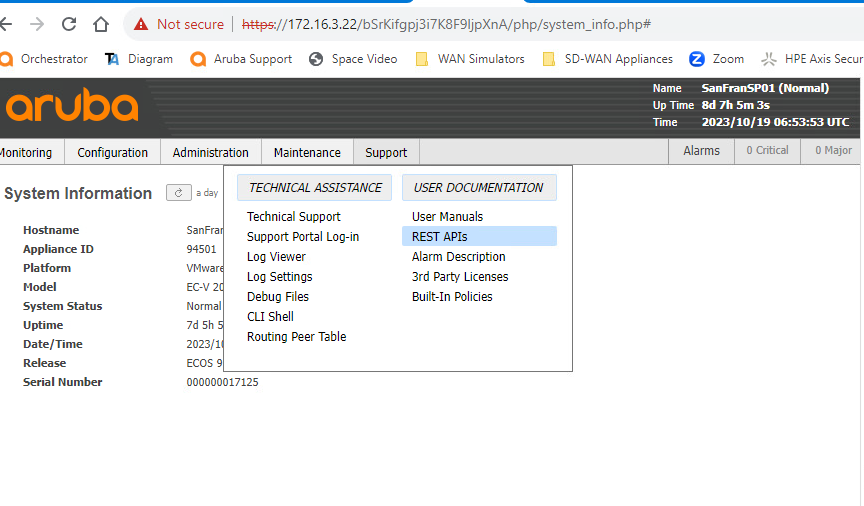
Login into the Orchestrator and select the Support > USER DOCUMENTATION select the REST APIs
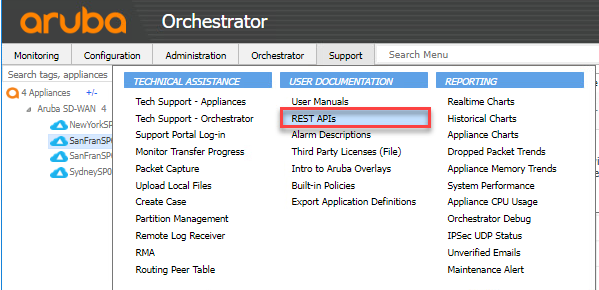
When selecting the Rest APIs you will then see the documentation about the REST APIs provided by Orchestrator. The documentation we need is the aggregateStats which is the ECOS aggregate statistics Select the aggregateStats tag.
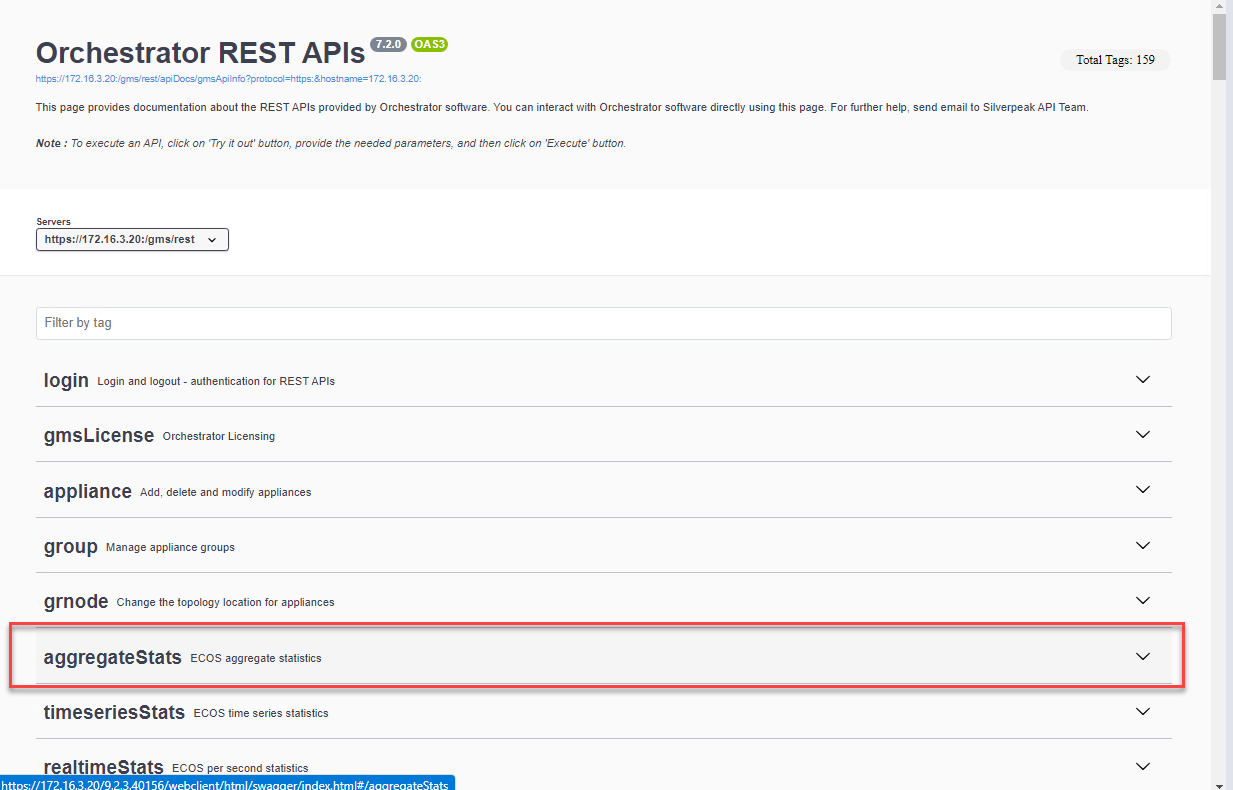
Selecting the aggregateStats tab expands the documentation. Select the the POST method for /stats/aggregate/interface
Once we expand the POST /stats/aggregate/interface documentation, we can try the API endpoint in swagger by selecting the Try it out button. Provide the required fields for the following:
- startTime
- endTime
- granularity
- trafficType
- format: leaving it with the dash will provide a JSON output or you can select csv
In the request body for ids "string" add the id of the appliances or appliances. For example, in our test case we use "1.NE" to get the aggregate stats for host SanFranSP01
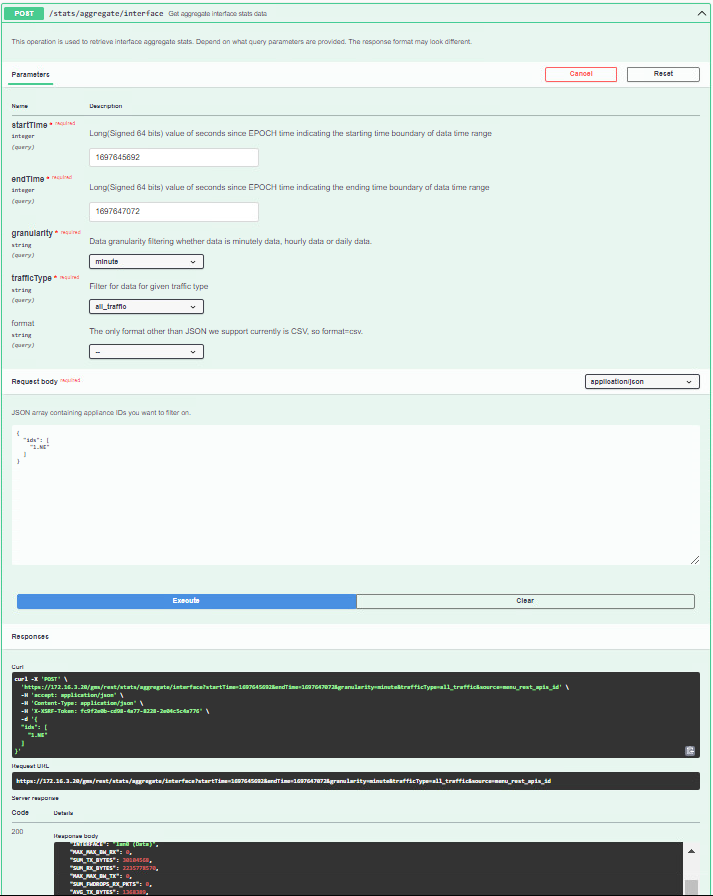
To derive some useful statistics, we can investigate the POST /stats/aggregate/interface endpoint. The JSON output file can help us find out the inbound and outbound bandwidth that was configured for the appliance during its deployment. This can be determined by analyzing the stats on the maximum bandwidth for RX and TX of the EdgeConnect appliances. It's important to note that this refers to the deployed bandwidth during the appliance's deployment process, not the interface. As an example, in our test, the EC-XS used had a deployment inbound and outbound bandwidth set to 900,000 kbps (see the image below).
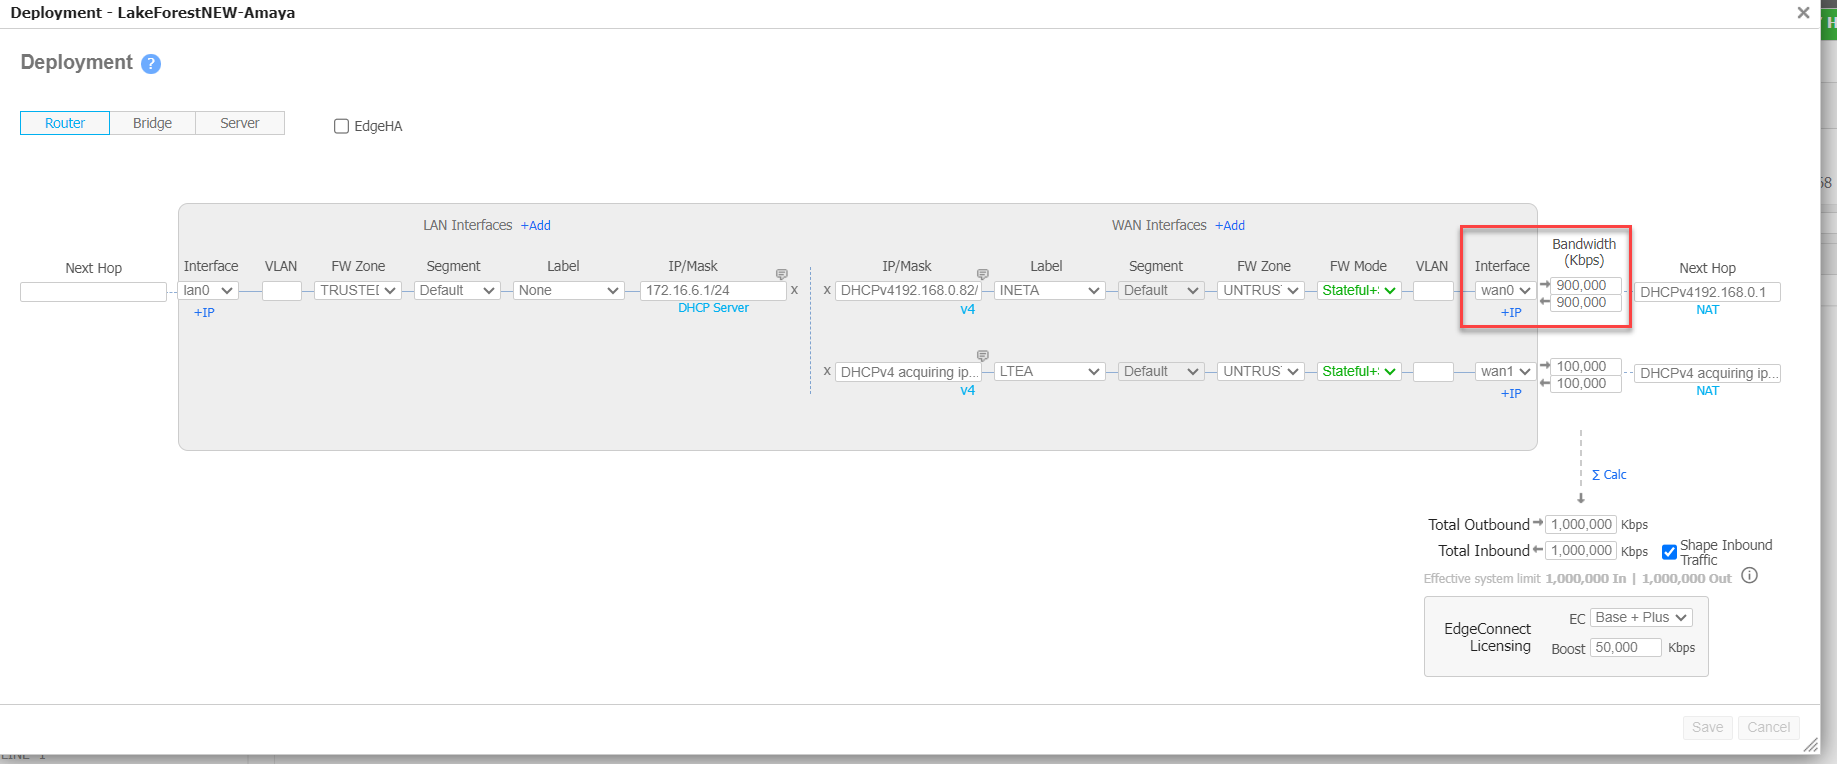
EC-XS deployed bandwidth of 900,000 kbps for inbound/outbound
A use case are Service Providers for example, they can provide EdgeConnect gateways with 10Gb interfaces, but the Service Provider could sell thier customers a 900Mb link interface which is what is configured in the deployment page for example purposes. The aggregate stats AVG_MAX_BW_TX or AVG_MAX_RX provides all the statistics for the deployed interface using the aggregate/interface endpoint.
In the example provided, we have a test case scenario where there is a single EdgeConnect appliance with a single LAN and WAN interface configured. The WAN interface was deployed with a 900Mb inbound and outbound for a total of 1,800,000 kbps. The second lnterface with label LTEA is not configured in the test setup for use.
There are two options when using the aggreagate interface statistics. We can calculate the average using the AVG RX/TX Bytes or we can calculate the total BW used RX and TX using the SUM results for the time period specified.
Calculating Inbound Avg Utilization %
To calculate inbound average utilization per interface, we can use the POST /stats/aggregate/interface along with the following formula for the Inbound Avg Utilization %:
((( AVG_RX_BYTES * 8 ) / multiplier) / ( AVG_MAX_BW_RX_ *1000) * 100)
Where
- AVG_MAX_BW_RX = is the configured interface in Orchestrator for the appliance interface on inbound
- AVG_RX_BYTES = is the average received bytes
- multiplier (if granularity is ‘minute’) = 60 (sec/min)
- multiplier (if granularity is ‘hour’) = (60 * 60) (sec/min * min/hr) * (no. of hours between start time and end time)
- multiplier (if granularity is ‘day’) = (24 * 60 * 60) (sec/min *min/hr * hr/ day) * (no. of days between start time and end time).
Calculating Outbound Avg Utilization %
To calculate outbound average utilization per interface, we can use the POST /stats/aggregate/interface along with the following formula for the Outbound Avg Utilization %:
((( AVG_TX_BYTES * 8 ) / multiplier) / ( AVG_MAX_BW_TX* 1000) * 100)
Where
- AVG_MAX_BW_TX = is the configured deployed interface in Orchestrator deployment page on outbound
- AVG_TX_BYTES = is the average received bytes
- multiplier (if granularity is ‘minute’) = 60 (sec / minute)
- multiplier (if granularity is ‘hour’) = (60 * 60) (sec/min * min/hr) * (no. of hours between start time and end time)
- multiplier (if granularity is ‘day’) = (24 * 60 * 60) (sec/min *min/hr * hr/day) * (no. of days between start time and end time).
These two calculations are for the average inbound and outbound utilization on the interface and the traffic type. Since we only have a single interface the output JSON file will show interface WAN0 and label INETA. And to get data for "all traffic" we will see a traffic type 4.
In the test example, I have deployed a single EC-XS with one WAN interface operating at 900,000 kbps for inbound/outbound traffic, and a single LAN interface. The nePk ID used is 1856.NE. To obtain aggregate statistics, we made use of the POST method for aggregate/interface in the Swagger application. I requested hourly average samples from Oct. 4 to Oct. 5, 4:39 PM - a total of 24 hours. With the appropriate multiplier, we can calculate the inbound and outbound average utilization percentage for the given period using the above formula.
The output files of the aggregate stats for the EC-XS :
| JSON Output file | Description | Unit |
|---|---|---|
| "nePk": "1856.NE", | appliance id | N/A |
| "SUM_TX_PKTS": 11585585, | total number of outbound packets for the queried time duration | packets |
| "MAX_OHEAD_RX_BYTES_MAX": 958672, | peak of maximum overhead bytes for inbound packets | bytes/min if granularity is minute bytes/hr if granularity is hour bytes/day if granularity is day |
| packets | total number of outbound forward drop packets for the queried time duration | packets |
| "MAX_TX_PKTS_MAX": 18747, | the peak of the maximum outbound packets | packets/min if granularity is minute packets/hr if granularity is hour packets/day if granularity is day |
| "AVG_MAX_BW_RX": 900000, | average of outbound maximum bandwidth for all interfaces. it is the same value as the interface inbound bandwidth field in the deployment tab | kbps (killo bytes per sec) |
| "MIN_TIMESTAMP": 1696438800, | minimum time stamp within the queried time duration for specified traffic type and the granularity. if we query for daily granularity, this value will be the value of the earliest daily boundary within queried time duration; if we query for hourly granularity, this value will be the value of the earliest hourly boundary within queried time duration; if we query for minute granularity, this value will be the value of the earliest minute boundary within queried time duration; | seconds |
| "SUM_RX_PKTS": 23177992, | total number of inbound packets for query time duration | packets |
| "AVG_MAX_BW_TX": 900000, | average of outbound maximum bandwidth for each interface for the queried time duration. Typically this value is the same as the configured interface inbound bandwidth field in the deployment tab. It will be different if the configured value changes within the queried time range. | kbps (killo bytes per sec) |
| "MAX_FWDROPS_TX_BYTES_MAX": 0, | the peak of maximum forward drop bytes for outbound packets; for daily granularity, we return hourly max value; for hourly and minute granularity, we return the minute max value; | bytes/min if granularity is minute bytes/hr if granularity is hour bytes/day if granularity is day |
| "TRAFFIC_TYPE": 4, | traffic type 1-optimized 2 passthrough-shaped, 3 pass-through-unshaped, 4 all traffic | N/A |
| "MAX_RX_PKTS_MAX": 92689, | peak of the maximum number of inbound packets | packets/min if granularity is minute packets/hr if granularity is hour packets/day if granularity is day |
| "MAX_FWDROPS_RX_PKTS_MAX": 0, | peak of the maximum number of forward drop packets for inbound packets | packets/min if granularity is minute packets/hr if granularity is hour packets/day if granularity is day |
| "MAX_OHEAD_TX_PKTS_MAX": 31, | peak of the maximum number of overhead packets for outbound packets | packets/min if granularity is minute packets/hr if granularity is hour packets/day if granularity is day |
| "INTERFACE": "wan0 (INETA)", | Interface name | N/A |
| "MAX_MAX_BW_RX": 900000, | the peak of maximum inbound bandwidth | kbps (kilobytes per second) |
| "SUM_TX_BYTES": 4131962601, | total number of outbound bytes | bytes |
| "SUM_RX_BYTES": 23123407151, | total number of inbound bytes | bytes |
| "MAX_MAX_BW_TX": 900000, | the peak of maximum outbound bandwidth for the queried time duration. Typically this value is the same as the configured interface inbound bandwidth field in the deployment tab. It will be different if the configured value changes within the queried time range. | kbps (kilobytes per second) |
| "SUM_FWDROPS_RX_PKTS": 167, | total number of inbound forward drop packets for queried time duration | packets |
| "AVG_TX_BYTES": 172165108.375, | outbound average bytes for the queried time range | packets/min if granularity is minute packets/hr if granularity is hour packets/day if granularity is day |
| "MAX_RX_BYTES_MAX": 114216440, | peak of maximum inbound bytes | bytes/min if granularity is minute bytes/hr if granularity is hour bytes/day if granularity is day |
| "AVG_RX_BYTES": 963475297.9583, | Inbound average bytes for the queried time range | bytes/min if granularity is minute bytes/hr if granularity is hour bytes/day if granularity is day |
| "SUM_OHEAD_TX_PKTS": 720958, | total number of outbound overhead packets | packets |
| "MAX_TX_BYTES_MAX": 6960661, | peak of maximum outbound bytes | bytes |
| "SUM_FWDROPS_RX_BYTES": 0, | total number of inbound forward drop bytes for queried time duration | bytes |
| "MAX_OHEAD_TX_BYTES_MAX": 10720, | the peak of maximum outbound overhead bytes | bytes/min if granularity is minute bytes/hr if granularity is hour bytes/day if granularity is day |
| "SUM_OHEAD_TX_BYTES": 113086640, | total number of outbound overhead bytes for query time duration | bytes |
| "SUM_OHEAD_RX_BYTES": 1200707360, | total number of inbound overhead bytes for query time duration | bytes |
| "SUM_FWDROPS_TX_BYTES": 0, | total number of outbound forward drop bytes for query time duration | bytes |
| "SUM_OHEAD_RX_PKTS": 3048562, | total number of inbound forward drop bytes for query time duration | bytes |
| "MAX_FWDROPS_RX_BYTES_MAX": 1240, | peak of maximum inbound forward drop bytes | packets/min if granularity is minute packets/hr if granularity is hour packets/day if granularity is day |
| "MAX_OHEAD_RX_PKTS_MAX": 749, | the peak of maximum inbound overhead packet | bytes/min if granularity is minute bytes/hr if granularity is hour bytes/day if granularity is day |
| "MAX_FWDROPS_TX_PKTS_MAX": 3, | the peak of maximum outbound forward drop packets | packets/min if granularity is minute packets/hr if granularity is hour packets/day if granularity is day |
| "MAX_TIMESTAMP": 1696521600, | maximum time stamp within the queried time duration for specified traffic type and the granularity. if we query for daily granularity, this value will be the value of the latest daily boundary within the queried time duration; if we query for hourly granularity, this value will be the value of the latest hourly boundary within queried time duration; if we query for minute granularity, this value will be the value of the lattest minute boundary within the queried time duration; | seconds |
The output JSON file provides us with the necessary information to now be able to configure our inbound and outbound average utilization.
To find the inbound average utilization we use the following formula:
Inbound Avg Utilization % = ((( AVG_RX_BYTES * 8) / multiplier) / (AVG_MAX_BW_RX* 1000)) * 100
We can see from the JSON file our AVG_RX_BYTES AND AVG_MAX_BW_RX
Given:
AVG_RX_BYTES = 963475298 bytes/min
Multiplier = 60 * 60 * (24)= 86400 sec
AVG_MAX_BW_RX = 900000 kbps
Now, plug in these values into the formula:
Inbound Avg Utilization % = (((963475298 * 8) / 86400) / (900000 _ *1000)) * 100
So, the Inbound Avg Utilization percentage is approximately 1.0%.
Next let's figure out the outbound Avg Utilization. We can use the similar formula:
Outbound Avg Utilization % = (((AVG_TX_BYTES * 8) / multiplier) / (AVG_MAX_BW_TX * 1000) * 100
Given:
AVG_TX_BYTES = 172165108 bytes/min
Multiplier = (60 * 60)*24 = 86400 sec
AVG_MAX_BW_TX = 900000 kbps
So, the Outbound Avg Utilization percentage is approximately .02%. If we are monitoring the outbound on our interface wan0 (INETA), this indicates that the outbound traffic is relatively light compared to the available bandwidth capacity.
ECOS Minute Stats /stats/minuteRange and /stats/minuteStats
The second statistic is the minute stats from the ECOS Rest APIs. Retrieving real-time statistics is typically every 5 minutes but with the ECOS Rest API, these stats can be retrieved every minute. The recommended ECOS APIs are the /stats/minuteRange which will generate a file. Then, the API endpoint retrieves the file using the GET /stats/minuteStats/{file}. It is preferable to use these two files over the /realtime stats which in turn can impact the Orchestrator's performance. Since the minute stats are generated every minute, you can configure a simple Python script to create and download the file every 5 minutes to have the latest interface statistics.
After we download the st2- file we need to unzip the file using the tar -xvf command. We will have a folder called st2-epochtime. In the folder, we will have several CSV and text files. Use the text files as they will be the most useful and will support the latest feature for distributed stats collectors. Also since we do not have an API key to login into the appliance like we do with the Orchestrator. We need to start a session with each appliance in order to get the stats that we want and close the session. We will need to do this for every single appliance we want to retrieve the statistics from.
The steps for initiating a session with the EdgeConnect gateways.
Log in directly to the appliance using the appliance using the credentials for each appliance we want to pull the stats file. In reality, the network operating team will have consistency across the deployed ECs in the SD-WAN fabric.
This will not work from the Orchestrator accessing the Appliance Manager for the EdgeConnect gateway.
Once we log in, we use the Swagger application. If you are unable to see the API documentation on Edgeconnect, then you will need to enable the api documentation from the EdgeConnect console using the CLI command: api docs enable
Once the docs have been enabled you will be able to return and log in to the Swagger application on the ECOS appliance. Go to Support > USER DOCUMENTATION > REST APIs
The API endpoint call to use is GET /stats/minuteRange. The API endpoint will generate a file that can be downloaded using a script or the swagger from the EdgeConnect appliance.
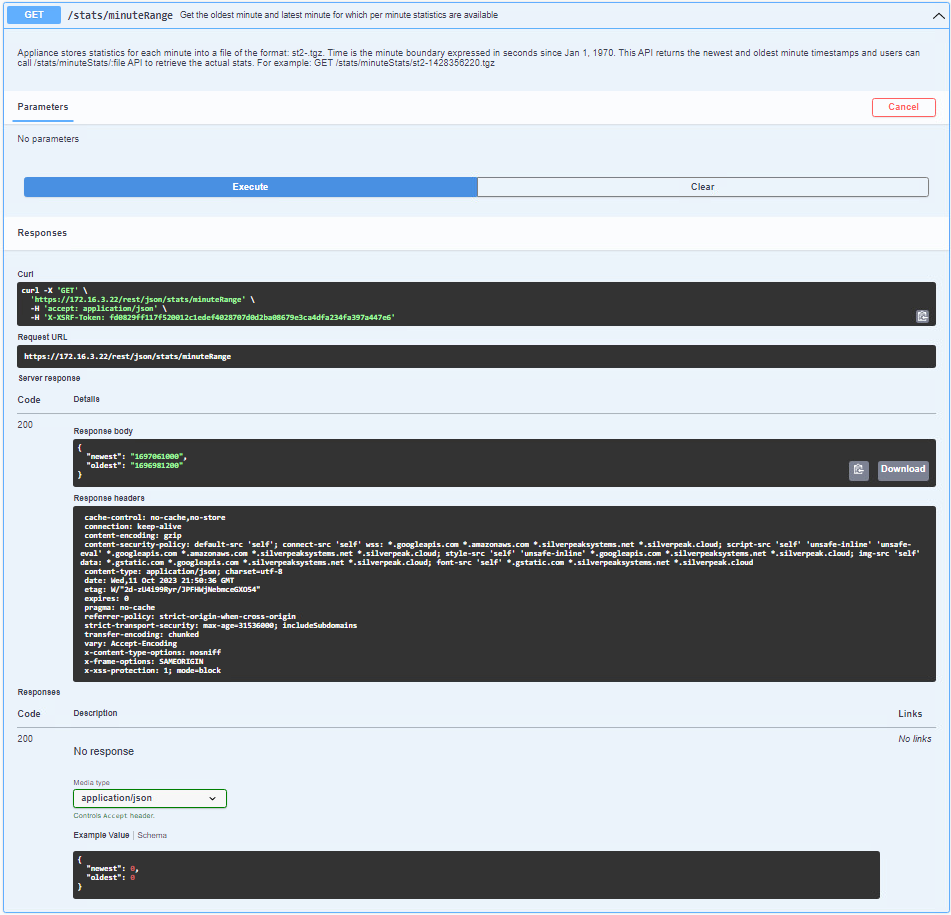
To download the file, you need to first check the response body from the minuteRange API. It will provide you with two numbers, representing the newest and oldest time boundaries, as shown in the image above. Once you have obtained the newest number, you can use it to download the minute stats file created for that minute.
To do this, you need to use the API endpoint /stats/minuteStats/{file}. In the "file" field, type in the name of the file you want to download, which always starts with st2- followed by the newest time, as shown in the example below.
To get the link to download the file, use the Swagger application and execute the request. If everything goes smoothly, you will receive a status code of 200, which provides you with the download file link, as shown in the example below. The next step is to download the file to a folder on a local system.
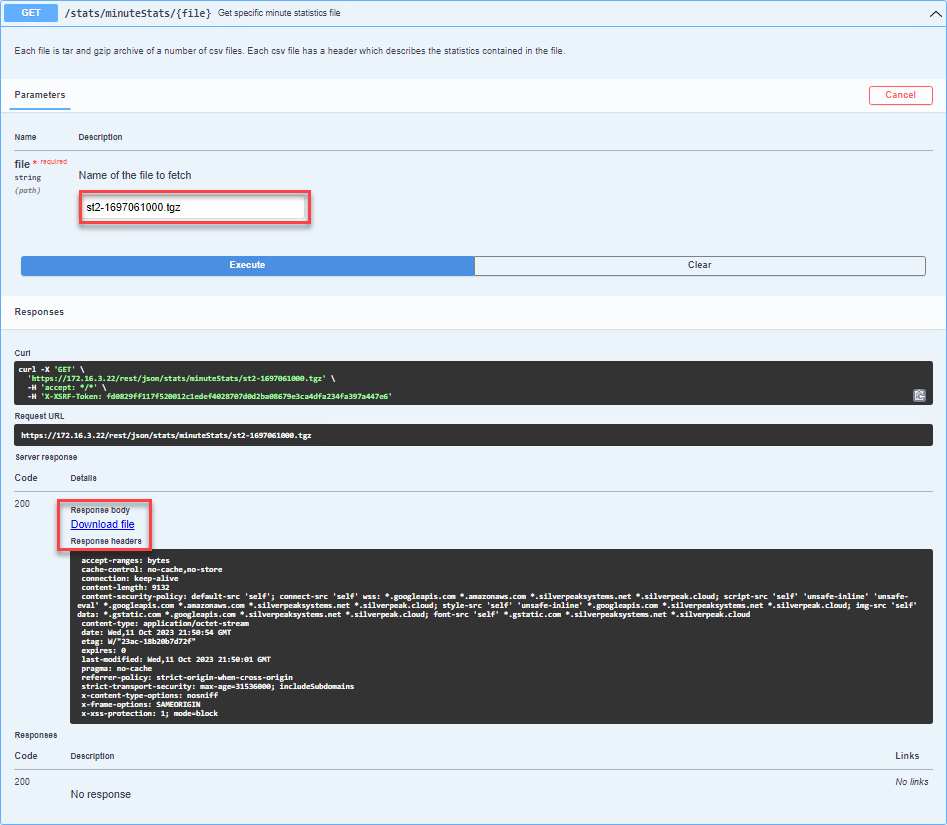
During our testing, we download a file using a specific link that results in a file being downloaded with the name 'application_octet-stream_st2-1697061000.tgz.blob_https__172.16.3.22_cbab3b94-1d21-4217-8515-818961093c2c'. Please note that this file name includes extra characters that are not needed, so it should be renamed to 'application_octet-stream_st2-1697061000.tgz' once downloaded. Once the renaming is complete, proceed to the directory where the file was downloaded using the command line.
run the command:
tar -xvf _application_octet-stream_st2-1697061000.tgz
The file will be extracted and will create a directory named \st2-1697061000. This directory will contain various statistical reports, one of which is the interface_v2.txt file. This file provides minute-by-minute stats on the appliance interfaces. However, the text file is not formatted and thus, needs to be parsed for raw data or copied over to a formatted table for better readability.
The minuteStats generates several reports, including health, interface, tunnels, overlay, firewall, and many more. In our example, we will focus on the interface_v2 text file. The table below shows the statistics, such as the bytes, packets inbound and outbound, and the maximum available bandwidth inbound and outbound, among others. Although there are other columns such as overhead and firewall, we will not cover those in this example. Below is the table explaining each column in the interface_v2 text file. The Excel file shows the raw text file in CSV format with the column names. highlighted that are most often used.
Interface_v2.txt Table:
| name | description |
|---|---|
| Orchestrator Appliance Key | Appliance ID (nePk) |
| interface name | name of the interface |
| interface label id | label 1-5 lan = 5, wan0 =2, wan1=1 |
| traffic type | 1-optimized, 2 passthrough-shaped, 3 pass-through-unshaped, 4 all traffic |
| bytes tx | bytes outbound at the time of the timestamp |
| bytes rx | bytes inbound at the time of the timestamp |
| tx packets | outbound packets |
| rx packets | inbound packets |
| overhead bytes tx | overhead bytes outbound |
| overhead bytes rx | overhead bytes inbound |
| overhead packets tx | overhead packets outbound |
| overhead packets rx | overhead packets inbound |
| firewall bytes tx | firewall bytes outbound |
| firewall bytes rx | firewall bytes inbound |
| firewall packets tx | firewall packets outbound |
| firewall packets rx | firewall packets inbound |
| max BW tx | maximum bandwidth outbound which is the deployed outbound bandwidth. |
| max BW rx | maximum bandwidth inbound which is the deployed inbound bandwidth. |
| timestamp | minute when the stats were collected in epoch |
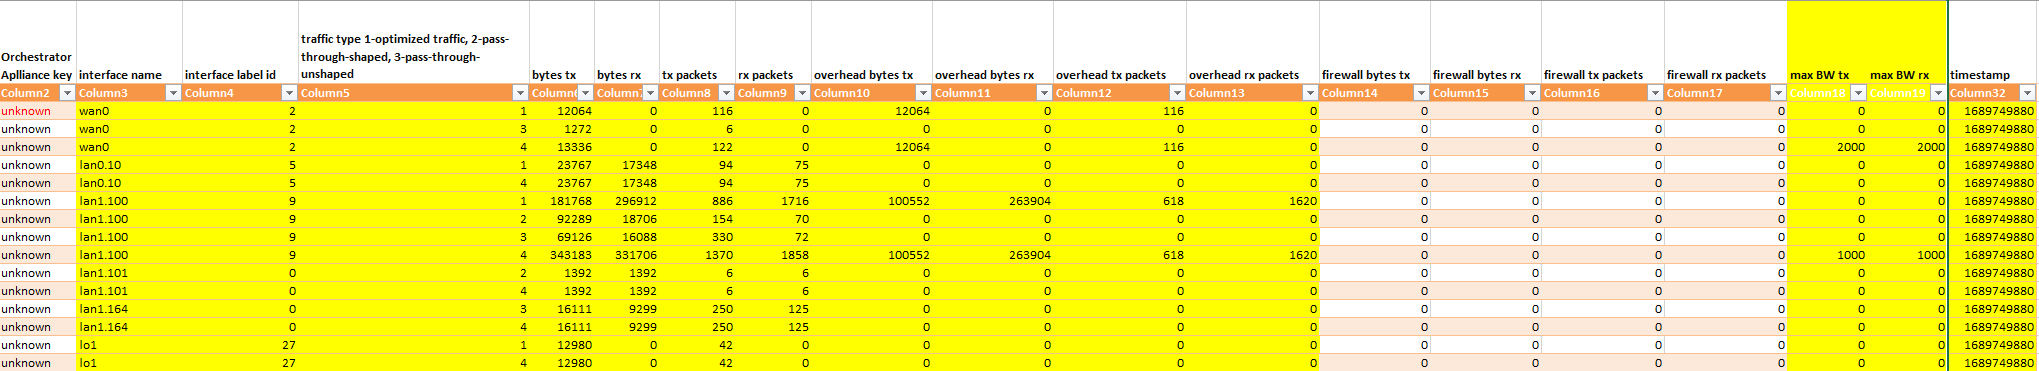
interface_v2.txt file sample with column description
Test Cases
To validate and demonstrate the statistics for the Orchestrator aggregate Stats and the ECOS minuteStats, we conducted three tests. In these tests, we used five EC-Vs with different deployed configurations. Only two EC-Vs were used for the test case and they were SYDNEYSP01 and SANFRANSP01. To generate traffic we used iperfclient behind SANFRANSP01 and iperf3Server behind SydneySP01. The iperf3 test used the default port 5201, we used iperf3 for a test application with 2M, 10M, and 40M to oversubscribe. We then used swagger for the aggregate stats and the minute stats for each of the test cases.
Topology
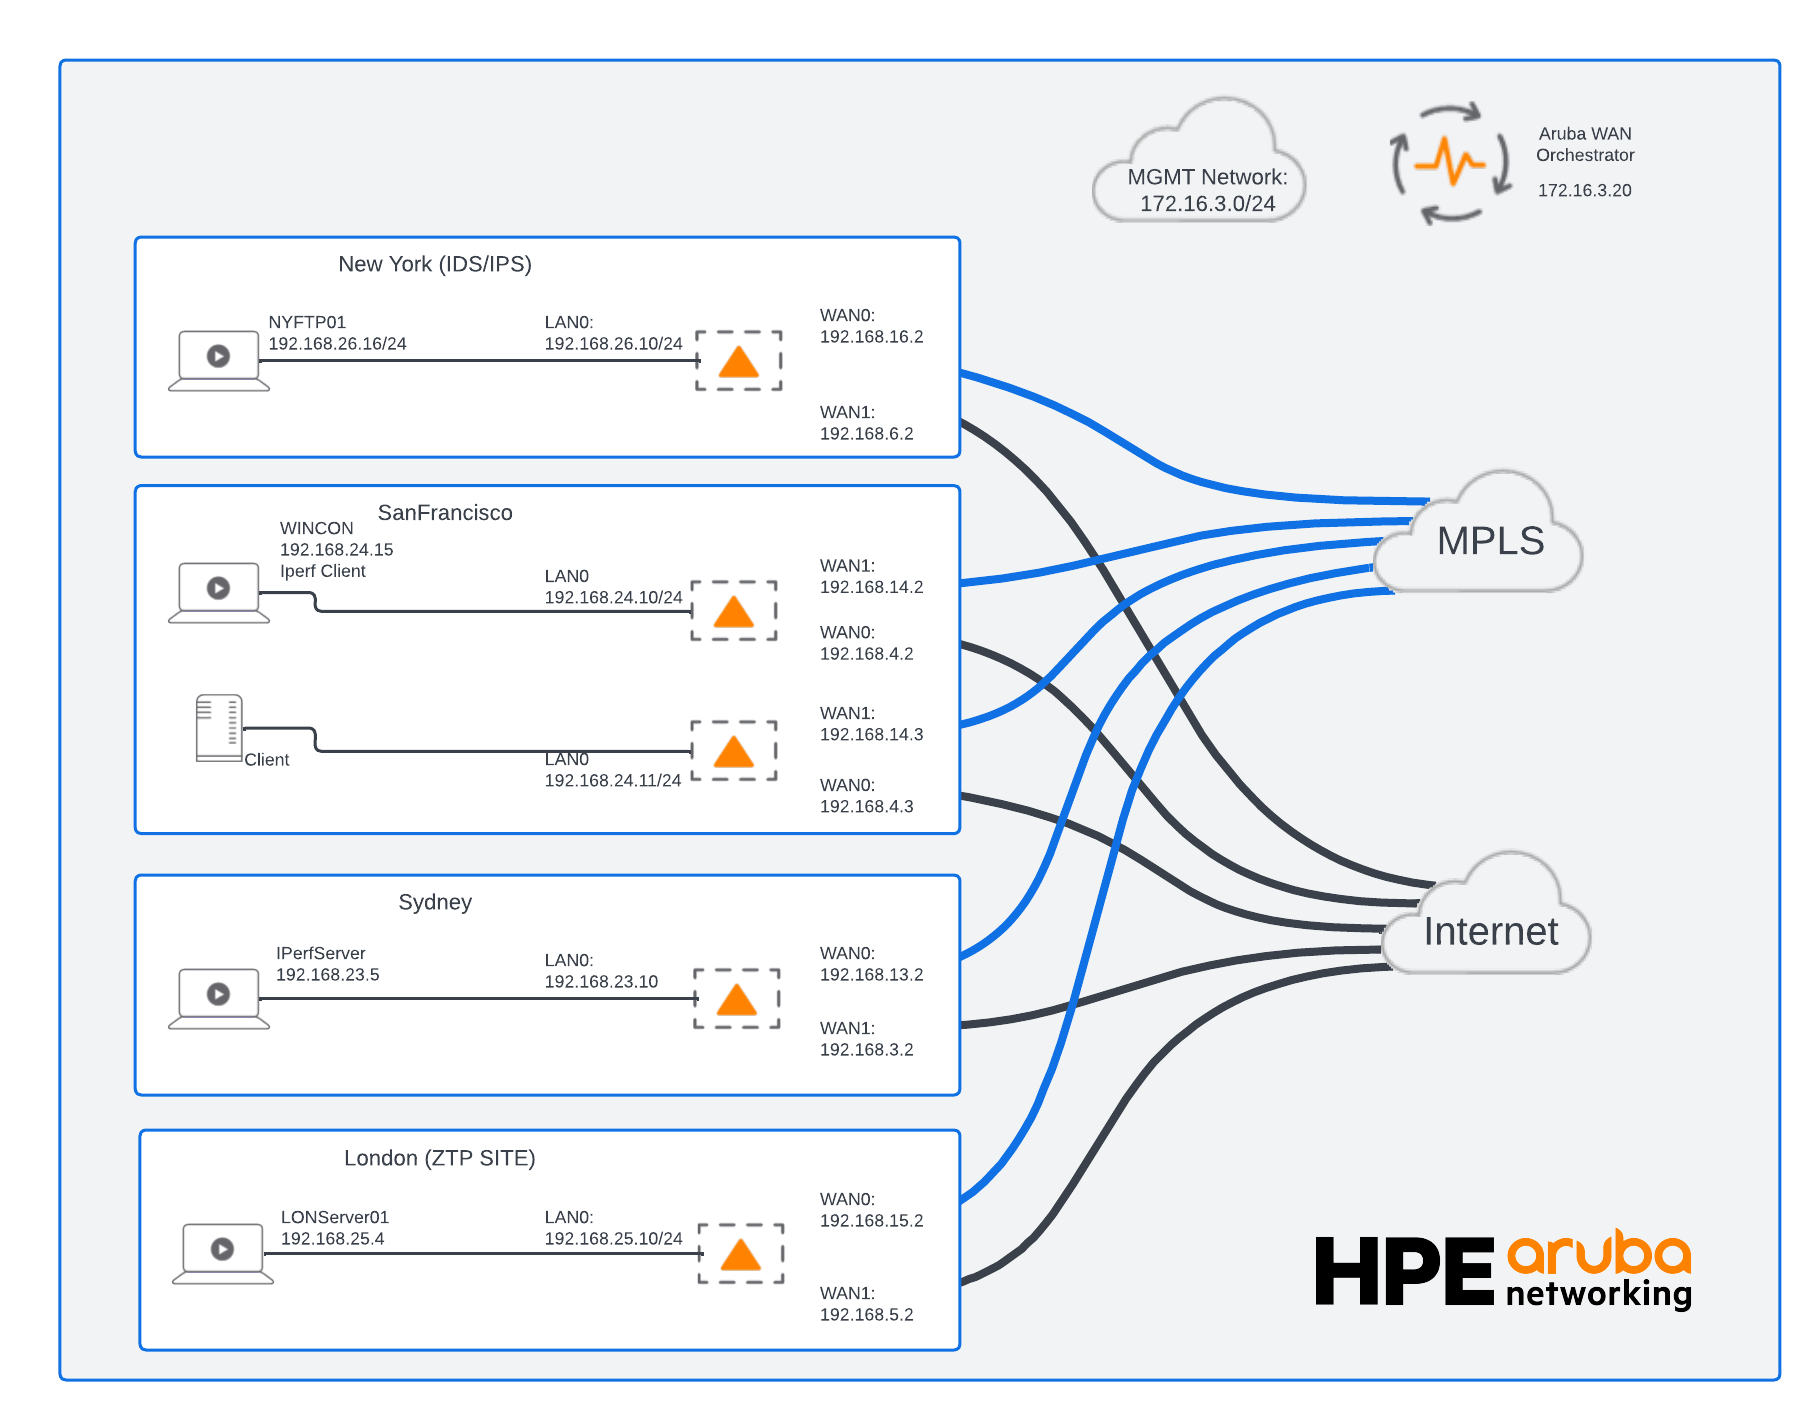
Topology for Test Cases
2M Test Case
The test case involves transferring 2 megabits of data between the SanFranSP01 and SydneySP01 sites using the iperf3 tool. Specifically, we are testing the performance of the wan0 (INET1) and wan1 (MPLS1) interfaces located in the SanFranSP01 site. It is important to note that we deliberately under-subscribed the interfaces in order to demonstrate how the data would be interpreted by the stats of these two interfaces.
Aggregate Stats Results
[
  {
    "SUM_TX_PKTS": 50838,
    "MAX_OHEAD_RX_BYTES_MAX": 0,
    "SUM_FWDROPS_TX_PKTS": 0,
    "MAX_TX_PKTS_MAX": 297,
    "AVG_MAX_BW_RX": 0,
    "SUM_RX_PKTS": 127377,
    "MIN_TIMESTAMP": 1697607720,
    "AVG_MAX_BW_TX": 0,
    "MAX_FWDROPS_TX_BYTES_MAX": 0,
    "TRAFFIC_TYPE": 4,
    "MAX_RX_PKTS_MAX": 305,
    "MAX_FWDROPS_RX_PKTS_MAX": 0,
    "MAX_OHEAD_TX_PKTS_MAX": 0,
    "INTERFACE": "lan0 (Data)",
    "MAX_MAX_BW_RX": 0,
    "SUM_TX_BYTES": 2981141,
    "SUM_RX_BYTES": 156619284,
    "MAX_MAX_BW_TX": 0,
    "SUM_FWDROPS_RX_PKTS": 0,
    "AVG_TX_BYTES": 298114,
    "MAX_RX_BYTES_MAX": 278126,
    "SUM_OHEAD_TX_PKTS": 0,
    "MAX_TX_BYTES_MAX": 268412,
    "AVG_RX_BYTES": 15661928,
    "nePk": "1.NE",
    "SUM_FWDROPS_RX_BYTES": 0,
    "MAX_OHEAD_TX_BYTES_MAX": 0,
    "SUM_OHEAD_TX_BYTES": 0,
    "SUM_OHEAD_RX_BYTES": 0,
    "IP": "172.16.3.22",
    "SUM_FWDROPS_TX_BYTES": 0,
    "SUM_OHEAD_RX_PKTS": 0,
    "MAX_FWDROPS_RX_BYTES_MAX": 0,
    "MAX_OHEAD_RX_PKTS_MAX": 0,
    "HOSTNAME": "SanFranSP01",
    "MAX_FWDROPS_TX_PKTS_MAX": 0,
    "MAX_TIMESTAMP": 1697608260
  },
  {
    "SUM_TX_PKTS": 97648,
    "MAX_OHEAD_RX_BYTES_MAX": 0,
    "SUM_FWDROPS_TX_PKTS": 0,
    "MAX_TX_PKTS_MAX": 250,
    "AVG_MAX_BW_RX": 10000,
    "SUM_RX_PKTS": 41365,
    "MIN_TIMESTAMP": 1697607720,
    "AVG_MAX_BW_TX": 10000,
    "MAX_FWDROPS_TX_BYTES_MAX": 0,
    "TRAFFIC_TYPE": 4,
    "MAX_RX_PKTS_MAX": 276,
    "MAX_FWDROPS_RX_PKTS_MAX": 0,
    "MAX_OHEAD_TX_PKTS_MAX": 0,
    "INTERFACE": "wan0 (INET1)",
    "MAX_MAX_BW_RX": 10000,
    "SUM_TX_BYTES": 112134468,
    "SUM_RX_BYTES": 5792577,
    "MAX_MAX_BW_TX": 10000,
    "SUM_FWDROPS_RX_PKTS": 0,
    "AVG_TX_BYTES": 11213446,
    "MAX_RX_BYTES_MAX": 272912,
    "SUM_OHEAD_TX_PKTS": 9019,
    "MAX_TX_BYTES_MAX": 199717,
    "AVG_RX_BYTES": 579257,
    "nePk": "1.NE",
    "SUM_FWDROPS_RX_BYTES": 0,
    "MAX_OHEAD_TX_BYTES_MAX": 0,
    "SUM_OHEAD_TX_BYTES": 1219088,
    "SUM_OHEAD_RX_BYTES": 1969984,
    "IP": "172.16.3.22",
    "SUM_FWDROPS_TX_BYTES": 0,
    "SUM_OHEAD_RX_PKTS": 14208,
    "MAX_FWDROPS_RX_BYTES_MAX": 0,
    "MAX_OHEAD_RX_PKTS_MAX": 0,
    "HOSTNAME": "SanFranSP01",
    "MAX_FWDROPS_TX_PKTS_MAX": 0,
    "MAX_TIMESTAMP": 1697608260
  },
  {
    "SUM_TX_PKTS": 48775,
    "MAX_OHEAD_RX_BYTES_MAX": 0,
    "SUM_FWDROPS_TX_PKTS": 0,
    "MAX_TX_PKTS_MAX": 90,
    "AVG_MAX_BW_RX": 5000,
    "SUM_RX_PKTS": 40243,
    "MIN_TIMESTAMP": 1697607720,
    "AVG_MAX_BW_TX": 5000,
    "MAX_FWDROPS_TX_BYTES_MAX": 0,
    "TRAFFIC_TYPE": 4,
    "MAX_RX_PKTS_MAX": 83,
    "MAX_FWDROPS_RX_PKTS_MAX": 0,
    "MAX_OHEAD_TX_PKTS_MAX": 0,
    "INTERFACE": "wan1 (MPLS1)",
    "MAX_MAX_BW_RX": 5000,
    "SUM_TX_BYTES": 56408416,
    "SUM_RX_BYTES": 5283632,
    "MAX_MAX_BW_TX": 5000,
    "SUM_FWDROPS_RX_PKTS": 0,
    "AVG_TX_BYTES": 5640841,
    "MAX_RX_BYTES_MAX": 11488,
    "SUM_OHEAD_TX_PKTS": 6427,
    "MAX_TX_BYTES_MAX": 99904,
    "AVG_RX_BYTES": 528363,
    "nePk": "1.NE",
    "SUM_FWDROPS_RX_BYTES": 0,
    "MAX_OHEAD_TX_BYTES_MAX": 0,
    "SUM_OHEAD_TX_BYTES": 906240,
    "SUM_OHEAD_RX_BYTES": 2157808,
    "IP": "172.16.3.22",
    "SUM_FWDROPS_TX_BYTES": 0,
    "SUM_OHEAD_RX_PKTS": 15825,
    "MAX_FWDROPS_RX_BYTES_MAX": 0,
    "MAX_OHEAD_RX_PKTS_MAX": 0,
    "HOSTNAME": "SanFranSP01",
    "MAX_FWDROPS_TX_PKTS_MAX": 0,
    "MAX_TIMESTAMP": 1697608260
  }
]
Inbound Average Bandwidth Utilization
To calculate the inbound average utilization for both WAN interfaces we use the following formula:
(((AVG_RX_BYTES * 8) / multiplier) / (AVG_MAX_BW_RX \ * 1000) *100
We can obtain the required results for both WAN interfaces from the JSON output file:
wan0 (INET1) deployed at 10,000 kbps
AVG_RX_BYTES = 579257 bytes/min
AVG_MAX_BW_RX =10000 kbps
multiplier = 60 sec /min
The "wan0 (INET1) Inbound Avg Utilization %" is approximately 0.77 %.
This indicates that only a small portion of the available inbound bandwidth (as defined by AVG_MAX_BW_RX=10,000 kbps or 10 Mbps) for "wan0 (INET1)" is being utilized based on the provided average received bytes (AVG_RX_BYTES=579257).
wan1 (MPLS1) deployed at 5,000 kbps
The "wan1 (MPLS1) Inbound Avg Utilization %" is approximately 1.4 %.
This indicates that only a small portion of the available inbound bandwidth (as defined by AVG_MAX_BW_RX=5,000 kbps or 5 Mbps) for "wan1 (MPLS1)" is being utilized based on the provided average received bytes (AVG_RX_BYTES=528363 bytes).
These results make sense as we were sending data out to another client with very little received data coming into the appliance.
Outbound Avg. BW Utilization
wan0 (INET1) deployed at 10,000 kbps
The Average Outbound BW Utilization Percentage (Outbound Avg Utilization %) is approximately 15%.
This is a very high utilization percentage, indicating that a significant portion of the available outbound bandwidth (as defined by AVG_MAX_BW_TX=10,000 kbps or 10 Mbps) is being used based on the provided average transmitted bytes AVG_TX_BYTES=11,213,446 bytes.
wan1(MPLS1) deployed at 5,000 Kbps
The "wan1 (mpls1) Outbound Avg Utilization %" is approximately 15%.
This indicates that a significant portion of the available outbound bandwidth (as defined by AVG_MAX_BW_TX = 5,000 kbps or 5 Mbps) for "wan1 (mpls1)" is being utilized based on the provided average transmitted bytes AVG_TX_BYTES=5,640,841 bytes).
These results make sense as we were sending data out to another client with large data going to another appliance.
Minute Stats Results from interface_v2.txt file
The minute stats show the data at the time the timestamp 1697607840 was created for 1.NE which in human-readable format is Tuesday, October 17, 2023, 10:44:00 PM GMT-07:00 DST. We parse the data to only show two of the rows from nine rows and also to only show 9 columns for the test case.
| Orchestrator Appliance ID key | Interface name | Interface lable ID | Traffic Type | bytes rx | bytes tx | max BW tx | max BW rx | timestamp |
|---|---|---|---|---|---|---|---|---|
| 1.NE | WAN0 | 2 | 4 | 550179 | 11270621 | 10000 | 10000 | 1697607840 |
| 1.NE | WAN1 | 1 | 4 | 532320 | 5668208 | 5000 | 5000 | 1697607840 |
To calculate the outbound bandwidth utilization for wan0 and wan1 using the minute stats, you will need to consider several parameters. The Orchestrator Appliance Key ID is the appliance, which in the test was SanFranSP01. The interface name refers to the WAN interface, while the interface label ID is labeled for both LAN and WAN.
The Traffic Type shows different traffic types, such as optimized traffic (1), passthrough-shaped (2), passthrough-unshaped (3), and All traffic (4).
Bytes TX and RX refer to the number of bytes transmitted and received at the minute timestamp. In addition, max BW TX and RX is the interface deployed bandwidth, which needs to be considered.
Finally, the timestamp refers to the minute when the stats were collected.
WAN0 (INET1)
We have 11270621 bytes TX for wan0 with a max bandwidth of 10,000 kbps, we can use the following to get the bandwidth utilization % for the minute.
(((BYTES TX * 8) /60) / MAX BW TX) * 100
(((11270621 * 8) / 60) / 10000) * 100
The bandwidth utilization is approximately 15% the outbound utilization indicating that we are not utilizing nearly the full capacity of the available bandwidth (10,000 kbps) during that specific minute. This indicates that during that specific minute, you're using about 15.03% of the available 10 Mbps bandwidth.
WAN1 (MPLS1)
We have 37027664 bytes TX for wan1 with a max bandwidth of 5,000 kbps, we can use the following to get the bandwidth utilization % for the minute.
(((BYTES TX * 8) /60) / MAX BW TX) * 100
(((5668208 * 8) / 60) / 5000000) * 100
The bandwidth utilization is approximately 15%. This indicates that during that specific minute, you're using about 15.12% of the available 5 Mbps bandwidth. At this point in time interface on the outbound we are not reaching the maximum.
10M Test Case
The test case involves transferring 10 megabits of data between the SanFranSP01 and SydneySP01 sites using the iperf3 tool. Specifically, we are testing the performance of the wan0 (INET1) and wan1 (MPLS1) interfaces located in the SanFranSP01 site. It is important to note that we deliberately created a 10M test to match INET1 interfaces in order to demonstrate how the data would be interpreted by the stats of these two interfaces.
Aggregate Stats Results
[
  {
    "SUM_TX_PKTS": 1029383,
    "MAX_OHEAD_RX_BYTES_MAX": 0,
    "SUM_FWDROPS_TX_PKTS": 0,
    "MAX_TX_PKTS_MAX": 664,
    "AVG_MAX_BW_RX": 0,
    "SUM_RX_PKTS": 3749143,
    "MIN_TIMESTAMP": 1697641860,
    "AVG_MAX_BW_TX": 0,
    "MAX_FWDROPS_TX_BYTES_MAX": 0,
    "TRAFFIC_TYPE": 4,
    "MAX_RX_PKTS_MAX": 1636,
    "MAX_FWDROPS_RX_PKTS_MAX": 0,
    "MAX_OHEAD_TX_PKTS_MAX": 0,
    "INTERFACE": "lan0 (Data)",
    "MAX_MAX_BW_RX": 0,
    "SUM_TX_BYTES": 54080128,
    "SUM_RX_BYTES": 4624015701,
    "MAX_MAX_BW_TX": 0,
    "SUM_FWDROPS_RX_PKTS": 0,
    "AVG_TX_BYTES": 916612,
    "MAX_RX_BYTES_MAX": 2028640,
    "SUM_OHEAD_TX_PKTS": 0,
    "MAX_TX_BYTES_MAX": 35756,
    "AVG_RX_BYTES": 78373147,
    "nePk": "1.NE",
    "SUM_FWDROPS_RX_BYTES": 0,
    "MAX_OHEAD_TX_BYTES_MAX": 0,
    "SUM_OHEAD_TX_BYTES": 0,
    "SUM_OHEAD_RX_BYTES": 0,
    "IP": "172.16.3.22",
    "SUM_FWDROPS_TX_BYTES": 0,
    "SUM_OHEAD_RX_PKTS": 0,
    "MAX_FWDROPS_RX_BYTES_MAX": 0,
    "MAX_OHEAD_RX_PKTS_MAX": 0,
    "HOSTNAME": "SanFranSP01",
    "MAX_FWDROPS_TX_PKTS_MAX": 0,
    "MAX_TIMESTAMP": 1697645340
  },
  {
    "SUM_TX_PKTS": 2527457,
    "MAX_OHEAD_RX_BYTES_MAX": 0,
    "SUM_FWDROPS_TX_PKTS": 0,
    "MAX_TX_PKTS_MAX": 965,
    "AVG_MAX_BW_RX": 10000,
    "SUM_RX_PKTS": 573115,
    "MIN_TIMESTAMP": 1697641860,
    "AVG_MAX_BW_TX": 10000,
    "MAX_FWDROPS_TX_BYTES_MAX": 0,
    "TRAFFIC_TYPE": 4,
    "MAX_RX_PKTS_MAX": 399,
    "MAX_FWDROPS_RX_PKTS_MAX": 0,
    "MAX_OHEAD_TX_PKTS_MAX": 0,
    "INTERFACE": "wan0 (INET1)",
    "MAX_MAX_BW_RX": 10000,
    "SUM_TX_BYTES": 3252366077,
    "SUM_RX_BYTES": 75736252,
    "MAX_MAX_BW_TX": 10000,
    "SUM_FWDROPS_RX_PKTS": 12406,
    "AVG_TX_BYTES": 55124848,
    "MAX_RX_BYTES_MAX": 51856,
    "SUM_OHEAD_TX_PKTS": 19376,
    "MAX_TX_BYTES_MAX": 1251548,
    "AVG_RX_BYTES": 1283665,
    "nePk": "1.NE",
    "SUM_FWDROPS_RX_BYTES": 2336036,
    "MAX_OHEAD_TX_BYTES_MAX": 0,
    "SUM_OHEAD_TX_BYTES": 3588688,
    "SUM_OHEAD_RX_BYTES": 7084096,
    "IP": "172.16.3.22",
    "SUM_FWDROPS_TX_BYTES": 0,
    "SUM_OHEAD_RX_PKTS": 39776,
    "MAX_FWDROPS_RX_BYTES_MAX": 0,
    "MAX_OHEAD_RX_PKTS_MAX": 0,
    "HOSTNAME": "SanFranSP01",
    "MAX_FWDROPS_TX_PKTS_MAX": 0,
    "MAX_TIMESTAMP": 1697645340
  },
  {
    "SUM_TX_PKTS": 1278999,
    "MAX_OHEAD_RX_BYTES_MAX": 0,
    "SUM_FWDROPS_TX_PKTS": 0,
    "MAX_TX_PKTS_MAX": 486,
    "AVG_MAX_BW_RX": 5000,
    "SUM_RX_PKTS": 548455,
    "MIN_TIMESTAMP": 1697641860,
    "AVG_MAX_BW_TX": 5000,
    "MAX_FWDROPS_TX_BYTES_MAX": 0,
    "TRAFFIC_TYPE": 4,
    "MAX_RX_PKTS_MAX": 335,
    "MAX_FWDROPS_RX_PKTS_MAX": 0,
    "MAX_OHEAD_TX_PKTS_MAX": 0,
    "INTERFACE": "wan1 (MPLS1)",
    "MAX_MAX_BW_RX": 5000,
    "SUM_TX_BYTES": 1650002464,
    "SUM_RX_BYTES": 72148388,
    "MAX_MAX_BW_TX": 5000,
    "SUM_FWDROPS_RX_PKTS": 0,
    "AVG_TX_BYTES": 27966143,
    "MAX_RX_BYTES_MAX": 43152,
    "SUM_OHEAD_TX_PKTS": 18354,
    "MAX_TX_BYTES_MAX": 630816,
    "AVG_RX_BYTES": 1222854,
    "nePk": "1.NE",
    "SUM_FWDROPS_RX_BYTES": 0,
    "MAX_OHEAD_TX_BYTES_MAX": 0,
    "SUM_OHEAD_TX_BYTES": 3253296,
    "SUM_OHEAD_RX_BYTES": 7434144,
    "IP": "172.16.3.22",
    "SUM_FWDROPS_TX_BYTES": 0,
    "SUM_OHEAD_RX_PKTS": 43086,
    "MAX_FWDROPS_RX_BYTES_MAX": 0,
    "MAX_OHEAD_RX_PKTS_MAX": 0,
    "HOSTNAME": "SanFranSP01",
    "MAX_FWDROPS_TX_PKTS_MAX": 0,
    "MAX_TIMESTAMP": 1697645340
  }
]
Inbound Avg. BW Utilization
wan0 (INET1) deployed at 10,000 kbps
AVG_RX_BYTES = 1283665 bytes/min
AVG_MAX_BW_RX =10000 kbps
multiplier = 60 sec /min
The "wan0 (INET1) Inbound Avg Utilization %" is approximately 1.7%.
This indicates that a relatively small portion of the available inbound bandwidth (as defined by AVG_MAX_BW_RX=10,000 kbps or 10 Mbps) for "wan0 (INET1)" is being utilized based on the provided average received bytes (AVG_RX_BYTES=1,283,665).
wan1 (MPLS1) deployed at 5,000 kbps
The "wan1 (MPLS1) Inbound Avg Utilization %" is approximately 3.3%.
This indicates that a relatively small portion of the available inbound bandwidth (as defined by AVG_MAX_BW_RX=5,000 kbps or 5 Mbps) for "wan1 (MPLS1)" is being utilized based on the provided average received bytes (AVG_RX_BYTES=1,222,854 bytes).
These results make sense as we were sending data out to another client with very little received data coming into the appliance.
Outbound Avg. BW Utilization
wan0 (INET1) deployed at 10,000 kbps
The Average Outbound BW Utilization Percentage (Outbound Avg Utilization %) is approximately 74%.
This is a very high utilization percentage, indicating that a significant portion of the available outbound bandwidth (as defined by AVG_MAX_BW_TX=10,000 kbps or 10 Mbps) is being used based on the provided average transmitted bytes AVG_TX_BYTES=55,124,848 bytes.
wan1(MPLS1) deployed at 5,000 Kbps
The "wan1 (mpls1) Outbound Avg Utilization %" is approximately 75%.
This indicates that a significant portion of the available outbound bandwidth (as defined by AVG_MAX_BW_TX = 5,000 kbps or 5 Mbps) for "wan1 (mpls1)" is being utilized based on the provided average transmitted bytes AVG_TX_BYTES=27,966,143 bytes).
These results make sense as we were sending data out to another client with large data going to another appliance.
Minute Stats Results from interface_v2.txt file
The minute stats show the data at the time the timestamp 1697642520 was created for 1.NE which in human-readable format is Wednesday, October 18, 2023, 8:22:00 AM GMT-07:00 DST. We parse the data to only show two of the rows from nine rows and also to only show 9 columns for the test case.
| Orchestrator Appliance key | Interface name | Interface label ID | Traffic Type | bytes tx | bytes rx | max BW tx | max BW rx | timestamp |
|---|---|---|---|---|---|---|---|---|
| 1.NE | wan0 | 2 | 4 | 55610930 | 1890918 | 10000 | 10000 | 1697642520 |
| 1.NE | wan1 | 1 | 4 | 27803216 | 710960 | 5000 | 5000 | 1697642520 |
To calculate the outbound bandwidth utilization for wan0 and wan1 using the minute stats, you will need to consider several parameters. The Orchestrator Appliance Key ID is the appliance, which in the test was SanFranSP01. The interface name refers to the WAN interface, while the interface label ID is labeled for both LAN and WAN.
The Traffic Type shows different traffic types, such as optimized traffic (1), passthrough-shaped (2), passthrough-unshaped (3), and All traffic (4).
Bytes TX and RX refer to the number of bytes transmitted and received at the minute timestamp. In addition, max BW TX and RX is the interface deployed bandwidth, which needs to be considered.
Finally, the timestamp refers to the minute when the stats were collected.
WAN0 (INET1)
We have 55610930 bytes TX for wan0 with a max bandwidth of 10,000 kbps, we can use the following to get the bandwidth utilization % for the minute.
(((BYTES TX* 8) /60) / MAX BW TX) * 100
(((55610930* 8) / 60) / 100000000) * 100
The bandwidth utilization is approximately 74%. This indicates that during that specific minute, you're using about 74% of the available 10 Mbps bandwidth.
WAN1 (MPLS1)
We have 37027664 bytes TX for wan1 with a max bandwidth of 5,000 kbps, we can use the following to get the bandwidth utilization % for the minute.
(((BYTES TX * 8) /60) / MAX BW TX) * 100
(((27803226 * 8) / 60) / 50000000) * 100
The bandwidth utilization is approximately 74% This indicates that during that specific minute, you're using about 74% of the available 5 Mbps bandwidth.
40M Test Case
The test case involves transferring 40 megabits of data between the SanFranSP01 and SydneySP01 sites using the iperf3 tool. Specifically, we are testing the performance of the wan0 (INET1) and wan1 (MPLS1) interfaces located in the SanFranSP01 site. It is important to note that we deliberately over-subscribed the bandwidth to demonstrate how the data would be interpreted by the stats of these two interfaces.
Aggregate Stats Results
[
  {
    "SUM_TX_PKTS": 556522,
    "MAX_OHEAD_RX_BYTES_MAX": 0,
    "SUM_FWDROPS_TX_PKTS": 0,
    "MAX_TX_PKTS_MAX": 579,
    "AVG_MAX_BW_RX": 0,
    "SUM_RX_PKTS": 1803282,
    "MIN_TIMESTAMP": 1697645700,
    "AVG_MAX_BW_TX": 0,
    "MAX_FWDROPS_TX_BYTES_MAX": 0,
    "TRAFFIC_TYPE": 4,
    "MAX_RX_PKTS_MAX": 1801,
    "MAX_FWDROPS_RX_PKTS_MAX": 0,
    "MAX_OHEAD_TX_PKTS_MAX": 0,
    "INTERFACE": "lan0 (Data)",
    "MAX_MAX_BW_RX": 0,
    "SUM_TX_BYTES": 30104568,
    "SUM_RX_BYTES": 2235778570,
    "MAX_MAX_BW_TX": 0,
    "SUM_FWDROPS_RX_PKTS": 0,
    "AVG_TX_BYTES": 1368389,
    "MAX_RX_BYTES_MAX": 2233240,
    "SUM_OHEAD_TX_PKTS": 0,
    "MAX_TX_BYTES_MAX": 37385,
    "AVG_RX_BYTES": 101626298,
    "nePk": "1.NE",
    "SUM_FWDROPS_RX_BYTES": 0,
    "MAX_OHEAD_TX_BYTES_MAX": 0,
    "SUM_OHEAD_TX_BYTES": 0,
    "SUM_OHEAD_RX_BYTES": 0,
    "IP": "172.16.3.22",
    "SUM_FWDROPS_TX_BYTES": 0,
    "SUM_OHEAD_RX_PKTS": 0,
    "MAX_FWDROPS_RX_BYTES_MAX": 0,
    "MAX_OHEAD_RX_PKTS_MAX": 0,
    "HOSTNAME": "SanFranSP01",
    "MAX_FWDROPS_TX_PKTS_MAX": 0,
    "MAX_TIMESTAMP": 1697646960
  },
  {
    "SUM_TX_PKTS": 1241820,
    "MAX_OHEAD_RX_BYTES_MAX": 0,
    "SUM_FWDROPS_TX_PKTS": 0,
    "MAX_TX_PKTS_MAX": 983,
    "AVG_MAX_BW_RX": 10000,
    "SUM_RX_PKTS": 316325,
    "MIN_TIMESTAMP": 1697645700,
    "AVG_MAX_BW_TX": 10000,
    "MAX_FWDROPS_TX_BYTES_MAX": 0,
    "TRAFFIC_TYPE": 4,
    "MAX_RX_PKTS_MAX": 498,
    "MAX_FWDROPS_RX_PKTS_MAX": 0,
    "MAX_OHEAD_TX_PKTS_MAX": 0,
    "INTERFACE": "wan0 (INET1)",
    "MAX_MAX_BW_RX": 10000,
    "SUM_TX_BYTES": 1612168078,
    "SUM_RX_BYTES": 41574580,
    "MAX_MAX_BW_TX": 10000,
    "SUM_FWDROPS_RX_PKTS": 4631,
    "AVG_TX_BYTES": 73280367,
    "MAX_RX_BYTES_MAX": 68704,
    "SUM_OHEAD_TX_PKTS": 6987,
    "MAX_TX_BYTES_MAX": 1278572,
    "AVG_RX_BYTES": 1889753,
    "nePk": "1.NE",
    "SUM_FWDROPS_RX_BYTES": 736204,
    "MAX_OHEAD_TX_BYTES_MAX": 0,
    "SUM_OHEAD_TX_BYTES": 1289936,
    "SUM_OHEAD_RX_BYTES": 2650784,
    "IP": "172.16.3.22",
    "SUM_FWDROPS_TX_BYTES": 0,
    "SUM_OHEAD_RX_PKTS": 14838,
    "MAX_FWDROPS_RX_BYTES_MAX": 0,
    "MAX_OHEAD_RX_PKTS_MAX": 0,
    "HOSTNAME": "SanFranSP01",
    "MAX_FWDROPS_TX_PKTS_MAX": 0,
    "MAX_TIMESTAMP": 1697646960
  },
  {
    "SUM_TX_PKTS": 579631,
    "MAX_OHEAD_RX_BYTES_MAX": 0,
    "SUM_FWDROPS_TX_PKTS": 0,
    "MAX_TX_PKTS_MAX": 494,
    "AVG_MAX_BW_RX": 5000,
    "SUM_RX_PKTS": 273995,
    "MIN_TIMESTAMP": 1697645700,
    "AVG_MAX_BW_TX": 5000,
    "MAX_FWDROPS_TX_BYTES_MAX": 0,
    "TRAFFIC_TYPE": 4,
    "MAX_RX_PKTS_MAX": 294,
    "MAX_FWDROPS_RX_PKTS_MAX": 0,
    "MAX_OHEAD_TX_PKTS_MAX": 0,
    "INTERFACE": "wan1 (MPLS1)",
    "MAX_MAX_BW_RX": 5000,
    "SUM_TX_BYTES": 752367152,
    "SUM_RX_BYTES": 35930704,
    "MAX_MAX_BW_TX": 5000,
    "SUM_FWDROPS_RX_PKTS": 0,
    "AVG_TX_BYTES": 34198506,
    "MAX_RX_BYTES_MAX": 39680,
    "SUM_OHEAD_TX_PKTS": 7151,
    "MAX_TX_BYTES_MAX": 638848,
    "AVG_RX_BYTES": 1633213,
    "nePk": "1.NE",
    "SUM_FWDROPS_RX_BYTES": 0,
    "MAX_OHEAD_TX_BYTES_MAX": 0,
    "SUM_OHEAD_TX_BYTES": 1274480,
    "SUM_OHEAD_RX_BYTES": 2743392,
    "IP": "172.16.3.22",
    "SUM_FWDROPS_TX_BYTES": 0,
    "SUM_OHEAD_RX_PKTS": 15800,
    "MAX_FWDROPS_RX_BYTES_MAX": 0,
    "MAX_OHEAD_RX_PKTS_MAX": 0,
    "HOSTNAME": "SanFranSP01",
    "MAX_FWDROPS_TX_PKTS_MAX": 0,
    "MAX_TIMESTAMP": 1697646960
  }
]
Inbound Avg. BW Utilization
wan0 (INET1) deployed at 10,000 kbps
AVG_RX_BYTES = 1889753 bytes/min
AVG_MAX_BW_RX =10000 kbps
multiplier = 60 sec /min
The "wan0 (INET1) Inbound Avg Utilization %" is approximately 2.5%.
This indicates that a relatively small portion of the available inbound bandwidth (as defined by AVG_MAX_BW_RX=10,000 kbps or 10 Mbps) for "wan0 (INET1)" is being utilized based on the provided average received bytes (AVG_RX_BYTES=1,889,753).
wan1 (MPLS1) deployed at 5,000 kbps
The "wan1 (MPLS1) Inbound Avg Utilization %" is approximately 4.4%.
This indicates that a relatively small portion of the available inbound bandwidth (as defined by AVG_MAX_BW_RX=5,000 kbps or 5 Mbps) for "wan1 (MPLS1)" is being utilized based on the provided average received bytes (AVG_RX_BYTES=1,633,213 bytes).
These results make sense as we were sending data out to another client with very little received data coming into the appliance.
Outbound Avg. BW Utilization
wan0 (INET1) deployed at 10,000 kbps
The Average Outbound BW Utilization Percentage (Outbound Avg Utilization %) is approximately 98%.
This is a very high utilization percentage, indicating that a significant portion of the available outbound bandwidth (as defined by AVG_MAX_BW_TX=10,000 kbps or 10 Mbps) is being used based on the provided average transmitted bytes AVG_TX_BYTES=73,280,367 bytes.
wan1(MPLS1) deployed at 5,000 Kbps
The "wan1 (mpls1) Outbound Avg Utilization %" is approximately 92%.
This indicates that a significant portion of the available outbound bandwidth (as defined by AVG_MAX_BW_TX = 5,000 kbps or 5 Mbps) for "wan1 (mpls1)" is being utilized based on the provided average transmitted bytes AVG_TX_BYTES=34,198,506 bytes).
These results make sense as we were sending data out to another client with large data going to another appliance.
Minute Stats Results from interface_v2.txt file
The statistics shown in the table below indicate the data that was generated for the nePk id 1.NE at the time when timestamp 1697646600 was created. In a more understandable format, this timestamp corresponds to Wednesday, October 18, 2023, 9:30:00 AM GMT-07:00 DST. For the test case, we have chosen to display only two rows and nine columns out of a total of nine rows and columns available in the interface_v2.txt report.
| Orchestrator Appliance Key ID | Interface Name | Interface label ID | Traffic Type | Bytes TX | Bytes RX | max BW tx | max BW rx | timestamp |
|---|---|---|---|---|---|---|---|---|
| 1.NE | wan0 | 2 | 4 | 73989648 | 1832579 | 10000 | 10000 | 1697646600 |
| 1.NE | wan1 | 1 | 4 | 37027664 | 1800944 | 5000 | 5000 | 1697646600 |
To calculate the outbound bandwidth utilization for wan0 and wan1 using the minute stats, you will need to consider several parameters. The Orchestrator Appliance Key ID is the appliance, which in the test was SanFranSP01. The interface name refers to the WAN interface, while the interface label ID is labeled for both LAN and WAN.
The Traffic Type shows different traffic types, such as optimized traffic (1), passthrough-shaped (2), passthrough-unshaped (3), and All traffic (4).
Bytes TX and RX refer to the number of bytes transmitted and received at the minute timestamp. In addition, max BW TX and RX is the interface deployed bandwidth, which needs to be considered.
Finally, the timestamp refers to the minute when the stats were collected.
WAN0 (INET1)
To calculate the bandwidth utilization percentage for a minute, we can use the following formula:
(((BYTES TX _ 8) /60) / MAX BW TX) * 100
To apply the formula, we need to know the number of bytes transmitted (number_1), the maximum bandwidth of wan0 (10,000 kbps), and the time duration (60 seconds).
Using these parameters, we can calculate the bandwidth utilization percentage as follows:
(((739896648 _ 8) / 60) / 100000000) * 100
If we have 1541451 bytes transmitted with a maximum bandwidth capacity of 15625, the outbound utilization percentage would be 99%. This indicates that we are utilizing almost the full capacity of the available bandwidth during that specific minute.
WAN1 (MPLS1)
We have transmitted 37027664 bytes through the WAN1, which has a maximum bandwidth of 5,000 kbps. To calculate the bandwidth utilization percentage for a minute, we can use the following formula:
(((BYTESTX 8) / 60) / MAX_BW_TX)* 100
By substituting the values, we get:
(((37027664 _ 8) / 60) / 50000000)* 100
The result of this calculation is 4628458 / 46875 = 99%, which means that we are utilizing almost the entire available bandwidth (5,000 kbps) during that minute. At this point, the outbound interface is reaching its maximum capacity.
Table: REST API Description Orchestrator vs. ECOS
| Orchestrator API Endpoint and Method | Description | ECOS API Endpoint and Method | Description |
|---|---|---|---|
| GET /stats/aggregate/interface | The Orchestrator API endpoint, /stats/aggregate/interface, allows you to retrieve interface aggregate statistics. The available aggregate stats are SUM, MAX, AVG, and MAX RX/TX, and you can choose to display them for a minute, an hour, or a day. Moreover, you can filter the traffic type and the output format, which can either be CSV or JSON. To download stats for multiple appliances, simply enter their nePk Ids in the body of the file. | GET /stats/minuteRange GET /stats/minuteStats/[file} | The ECOS API has two endpoints that produce minute statistics for each appliance based on the newest and oldest minute timestamp available at the time of executing the command. |
Conclusion
Based on the information provided, we can determine whether the current interface is overused or has enough capacity. Two REST API endpoints provide interface information. If we need averages or maximums, we should use the aggregate stats. However, if we need real-time stats up to the minute, the minute stats from the ECOS appliance are the best option. We can also calculate the 95th percentile if needed. Unfortunately, the Orchestrator lacks the capacity management feature to provide such information. Therefore, we need to collaborate with third-party partners or use SEIM applications to obtain these statistics and guidance. This document aims to help us achieve this goal. For example, "pyedgeconnect telemetry" demo, which is an open-source product available on Github, demonstrates how we can measure and display statistics on a graphical dashboard like Grafana. Access to the pyedgeconnect telemetry demo
Updated 12 months ago