
Getting Started with NAE
Installing Scripts and Creating Agents
Introduction
The HPE Aruba Networking Network Analytics Engine (NAE) is a first-of-its-kind built-in analytics framework for network assurance and remediation, with no license or extra software download required.
Capitalizing on the full automation and deep visibility capabilities of AOS-CX, this unique technology allows monitoring, troubleshooting, and effortless network data collection by employing simple script agents.

When an issue arises, the NAE agent offers information needed to resolve the issue and, even better, can take corrective action based on established policies. When it detects an anomaly, it proactively collects additional statistics and data to automate the troubleshooting process.
NAE scripts make use of the power of Python, APIs, and databases, and each script contains its own recipe or instructions required to spawn agents.
The logical makeup of an NAE script can be broken down into monitors, rules, conditions, and actions. As a monitor watches over a specified switch database value, an associated rule and condition determines when an alert may be triggered should the tracked value deviate from the predefined acceptable range. When an alert is triggered, NAE can also take corrective steps to rectify the issue.
The agent is also represented on an automatically generated graph which enables visual analysis to assist in troubleshooting network issues. Furthermore, the graph captures all configuration checkpoints to provide supplementary historical context to the timeline.
In order for NAE to process API calls there needs to be some configuration done on the switch's CLI.
Also, agents require administrator authority to perform certain tasks, such as executing CLI commands. Thus you must be logged in as a user possessing administrator privileges in order to create, delete, enable, disable, or reconfigure agents.
NAE Components
Script
NAE scripts are written in Python. The script is the exact Python code wherein the monitors, the alert-trigger logic, and the remedial actions are defined.
To upload an NAE script with the REST API, you must first convert the file to base64 encoding.
If you upload the script using the Web UI, the conversion is done automatically.
NAE-Lite ScriptsNAE-Lite scripts are built using the CLI, however the AOS-CX switch actually converts it into python. This script can be viewed on the Web UI
Agent
NAE agents are instances of scripts that are instantiated by users to run. Once activated, these agents collect relevant network information and also trigger alerts when specific events occur.
Monitor
Monitors track data points on the switch. Each monitor uses the REST URI of a resource to identify and keep tabs on that particular field.
Databases
NAE is tied to the switch's configuration and state database, as well as a time-series database. NAE monitors the values in the configuration and state database and tracks their history in the time-series database.
- Through the AOS-CX REST API, NAE has direct visibility into the entire current state of the device, including all statistics. This omniscience also helps agents correlate a network event to a specific configuration change, which is useful when analyzing whether the root cause of an issue is related to such a configuration change.
- The tie-in with the time-series database gives users the ability to essentially rewind time and revisit the context surrounding a network event.
REST APIThe REST API is covered in the AOS-CX API section.
Programmable Actions
Actions are tasks executed by agents in response to predefined conditions. Actions can be automated to emulate many of the steps an administrator might take to troubleshoot network issues.
Although an action must be specified as part of a rule, actions are optional.
Built-in agents, such as system_resource_monitor.default, cannot be deleted.
Enabling REST API Access on the Switch
Changing the mode to read-write allows POST, PUT, and DELETE operations to be called on all configurable elements in the switch configuration database.
switch(config)# user admin group administrators password plaintext mypassword
switch(config)# https-server rest access-mode read-write
switch(config)# https-server vrf mgmt
switch(config)# https-server vrf default
By using these command, you enable access to both the Web UI and to the REST API on the specified VRF. You can enable access on multiple VRFs.
As of v10.04 by default, REST access-mode is set to read-write on the default VRF.
HPE Aruba Networking Aruba Solution Exchange
For scripts that are created, tested, and curated by HPE Aruba Networking, the HPE ANW Aruba Solution Exchange (ASE) is the place to browse. Best practice is to install only NAE scripts from ASE, as these scripts are written, tested, and certified by HPE Aruba Networking for specified platforms and firmware versions.
On ASE, HPE Aruba Networking certified scripts possess the tag nae-aruba-certified. These scripts can be downloaded here: HPE ANW Aruba Solution Exchange.
NAE-Lite
If running AOS-CX firmware version 10.10 or later, there is a CLI based implementation of the Networking Analytics Engine called NAE-Lite. This enables administrators the capability to create agents for monitoring data without the need of any programming or Python knowledge.
NAE-Lite agents still have the capability to:
- Monitor a resource
- Validate a Condition being met/exceeded
- Execute actions when those conditions occur
When to use NAE vs NAE-Lite
The HPE Aruba Networking Network Analytics Engine helps customers get the most out of their technology investments
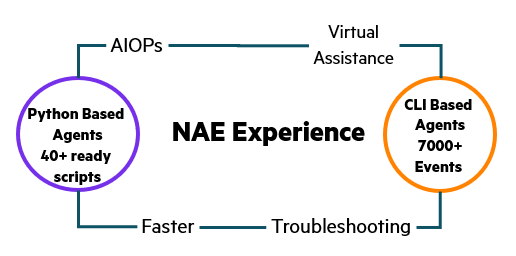
If the user wants a quick agent that can monitor for a log event and take basic actions without the use or knowledge of Python programming, NAE-Lite is a fast and easy way to get started.
If the user wants an in depth agent that can monitor for most statistics and configurations on the AOS-CX switch and have the agent make multiple, advanced callback actions both internally and externally of the device, the Python based NAE agents are the best direction.