
Example Queries
This guide provides a collection of real-world questions you can ask the Central MCP server, organized by common operational tasks and troubleshooting scenarios.
How to ask
A few things make the assistant feel natural to work with:
- Use plain language. "Which sites are unhealthy?" works as well as a precise query. You don't
need exact tool names or syntax. - You don't need IDs up front. Ask about "the London campus" or "the Miami branch" by name —
the assistant resolves names to the right site behind the scenes. - Follow-ups keep context. Ask "are there any offline devices in London?", then just
"when did that AP go down?" — the assistant remembers what you were looking at. - Start broad, then drill in. A good first question is "give me a health overview of all
sites." From there, zoom into whatever needs attention.
The sections below follow that same path — from a network-wide view down to a single port.
1. Network Health Overview
Start here. One question gives you a ranked, at-a-glance picture of every site so you know where to
look first.
Powered by the Sites tools (central_get_summary, central_get_sites).
🗨️ "Give me a health overview of all sites."
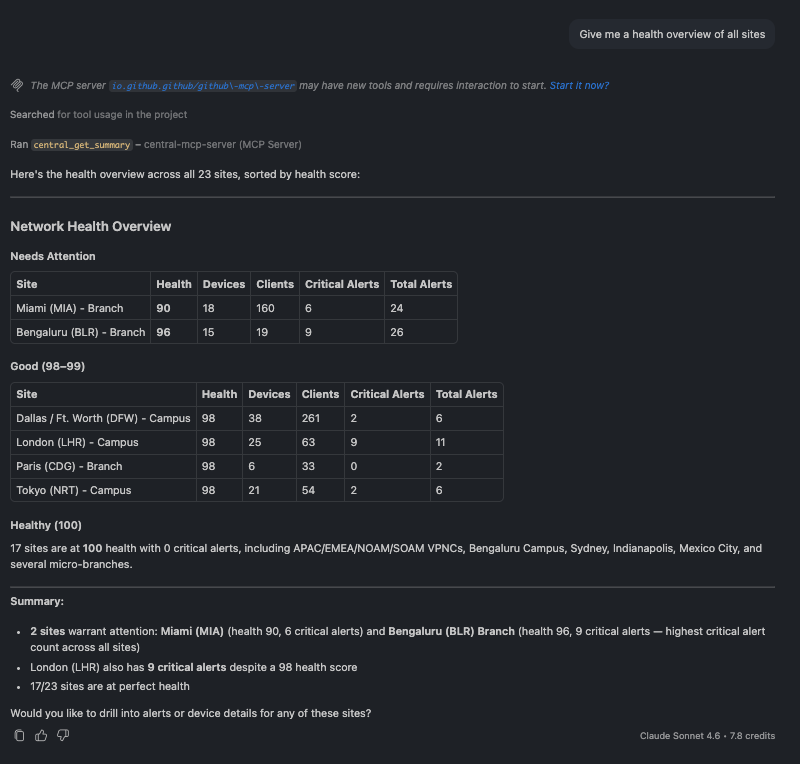
Health overview of all sites, ranked worst to best with device, client, and alert counts
The assistant returns every site ranked from worst to best health, with device, client, and alert counts beside each — a fleet-wide status board in one answer.
You can then sharpen the focus:
🗨️ "Which sites have the most critical alerts right now?"
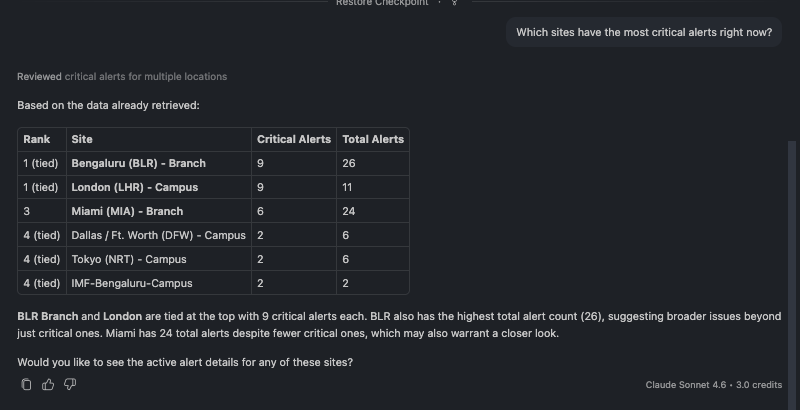
Sites ranked by number of critical alerts
A useful gut-check: a site can have a high health score and still carry critical alerts. This question surfaces exactly those cases.
🗨️ "Show me detailed health for the London and Miami sites."
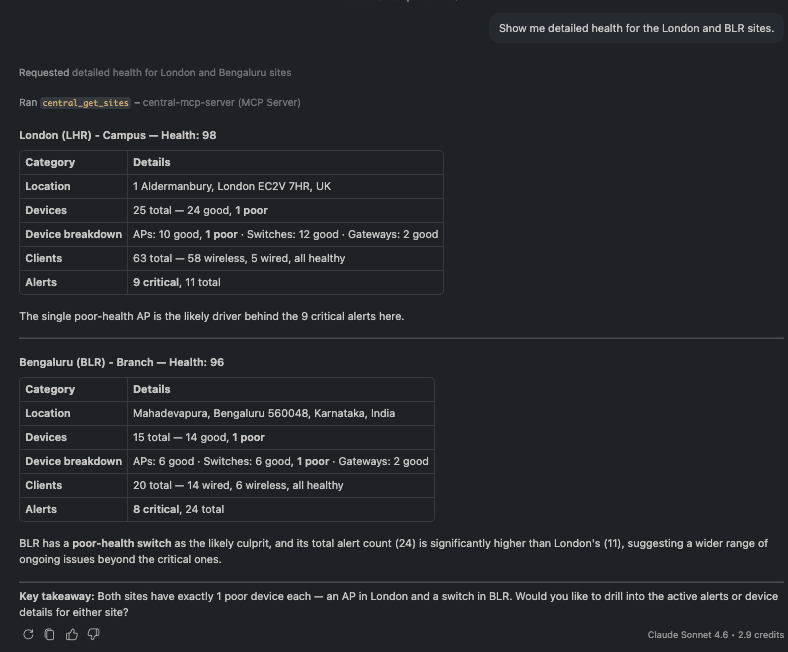
Side-by-side health breakdown for two sites by device type
Drill into specific sites and you get a device-type breakdown — for example, which switches or APs are dragging a site's score down.
More you can ask:
- "Are there any sites in poor or fair health?"
- "How many total devices and clients does my network have?"
- "Which campus has the highest client load?"
- "Show me all branch sites and their health scores."
- "Which sites have zero alerts right now?"
2. Finding Devices
Locate any device — or sweep the whole network for the ones that need attention — without knowing serial numbers in advance.
Powered by the Devices tools (central_get_devices, central_find_device).
🗨️ "Are there any offline devices in the network?"
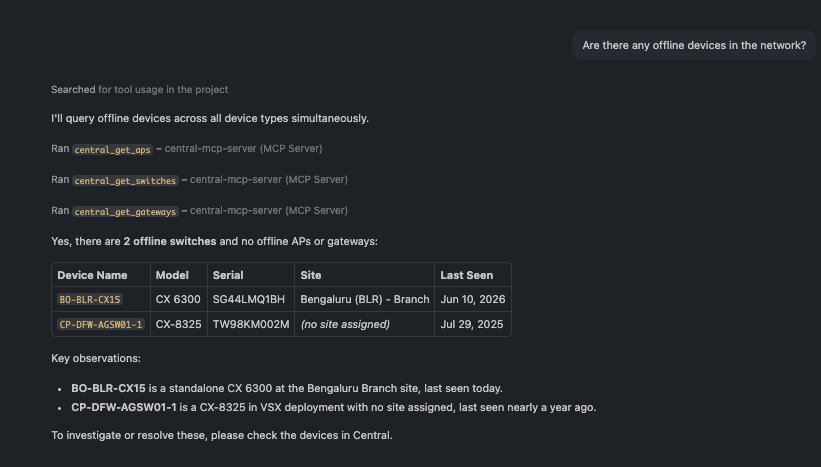
A short list of offline devices across all sites with their type and location
A short, actionable answer: which devices are down, what type they are, and where. In this environment it's one switch in Bengaluru and one switch with no site assigned.
🗨️ "Find the switch SG34L5002Y."
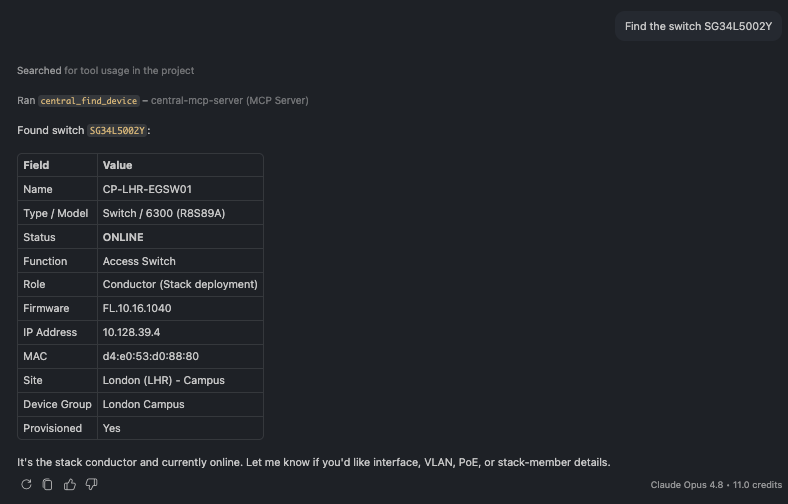
A single device profile card with model, status, role, site, and firmware
Look up one device by serial number (or name) and get its full profile — model, status, role, site, IP, and firmware.
🗨️ "List all devices at the London campus, broken down by type."
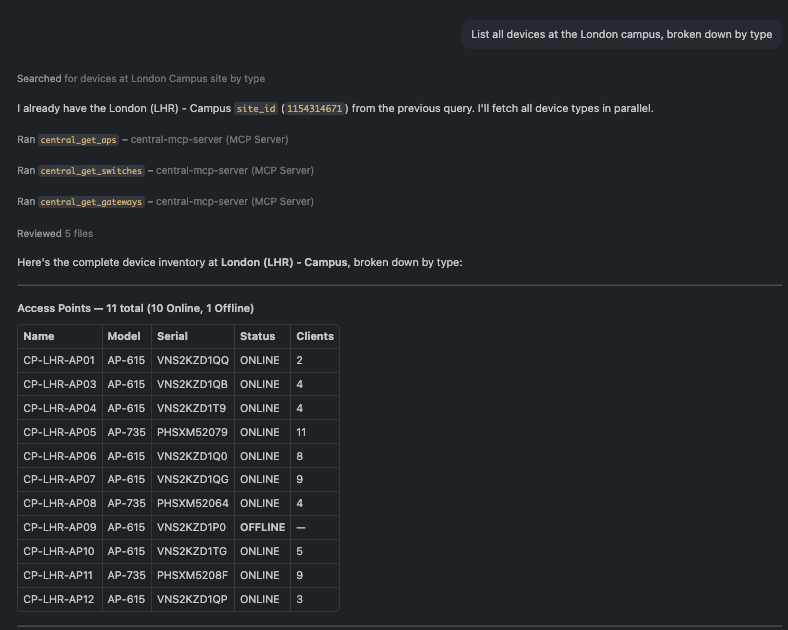
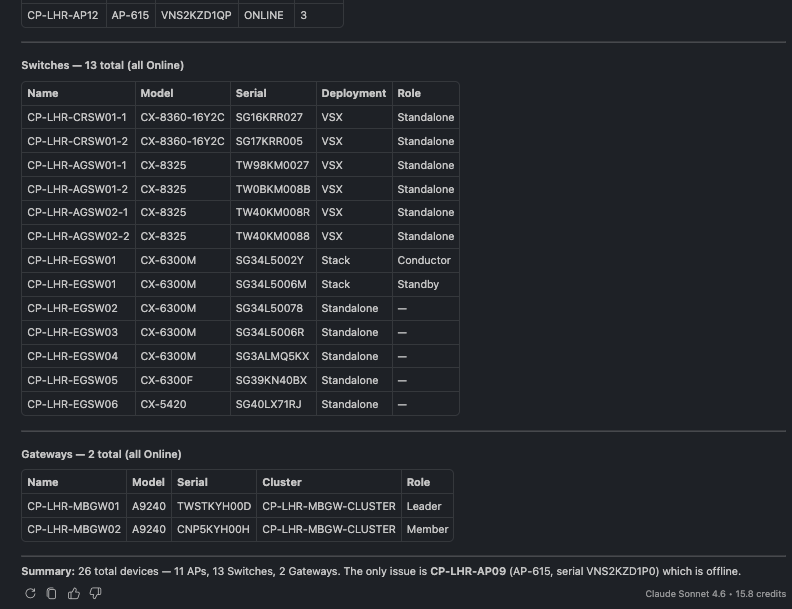
Full London inventory grouped into access points, switches, and gateways
Scope to a site and the assistant returns a clean inventory grouped into access points, switches, and gateways.
More you can ask:
- "Show me all offline switches across the network."
- "What access points are deployed at the London campus?"
- "Show all gateway devices in the network."
- "What firmware version is CP-LHR-EGSW01 running?"
- "Are there any devices not assigned to a site?"
3. Access Points
Inventory your wireless, then go deep on a single AP's radios and trends — useful when a coverage
area feels slow.
Powered by the AP monitoring tools (central_get_aps, central_get_ap_details, central_get_ap_trends).
🗨️ "What's the RF health on AP PHSXM52079?"
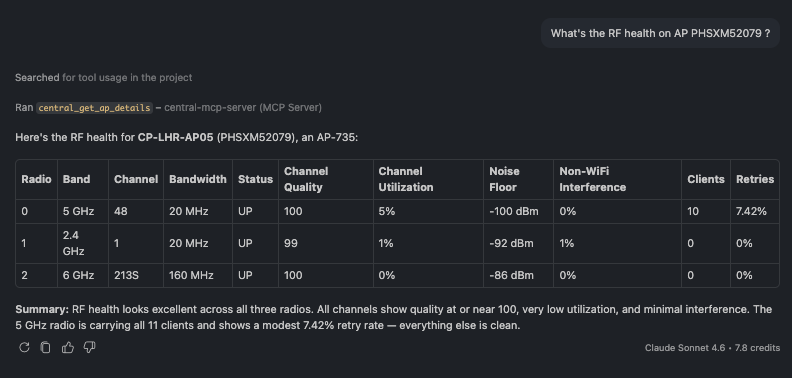
Per-radio RF table for one AP showing band, channel, client count, channel quality, and noise floor
A per-radio breakdown for a single AP — band, channel, client count, channel quality, channel
utilization, and noise floor across 2.4 / 5 / 6 GHz. Here all the clients sit on 5 GHz while the
6 GHz radio is idle, and channel quality is 98–100 across the board (excellent RF).
🗨️ "Show me all access points at the London campus."
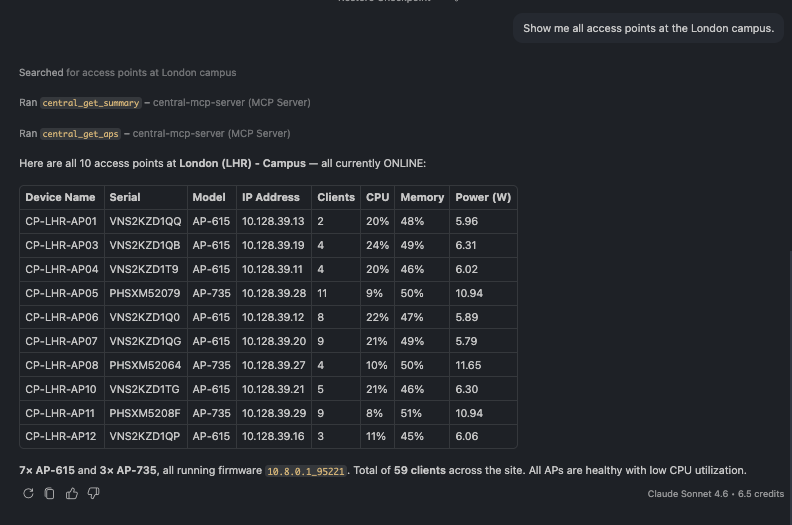
Site AP inventory with model, client count, CPU, memory, and power per AP
A site-scoped AP list with live load per AP — model, client count, CPU, memory, and PoE draw.
🗨️ "Show channel utilization on radio 0 of PHSXM52079 for the last hour."
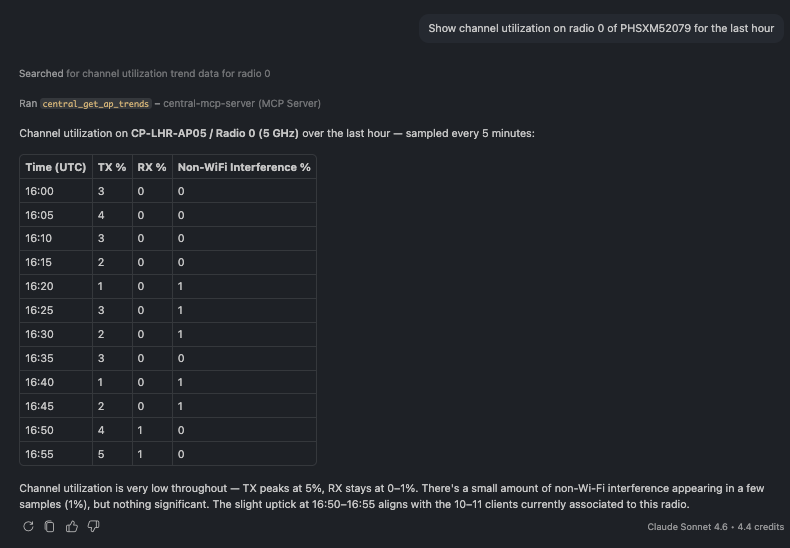
Time-series channel utilization samples for one radio over the last hour
Trends turn a snapshot into a story — here, 5-minute samples of transmit/receive utilization and non-Wi-Fi interference, so you can see whether a radio is congested or quiet.
More you can ask:
- "How many APs do we have across the network, by model?"
- "Which APs have more than 8 clients right now?"
- "Show me all offline APs across the network."
- "What's the throughput trend on CP-LHR-AP05 over the last 24 hours?"
- "What WLANs is CP-LHR-AP05 broadcasting?"
4. Switches
From a campus switch list down to per-port PoE and per-member hardware health on a single stack.
Powered by the switch monitoring tools (central_get_switches, central_get_switch_details, central_get_switch_trends).
🗨️ "Show me full details for switch SG34L5002Y — interfaces, PoE, and hardware health."
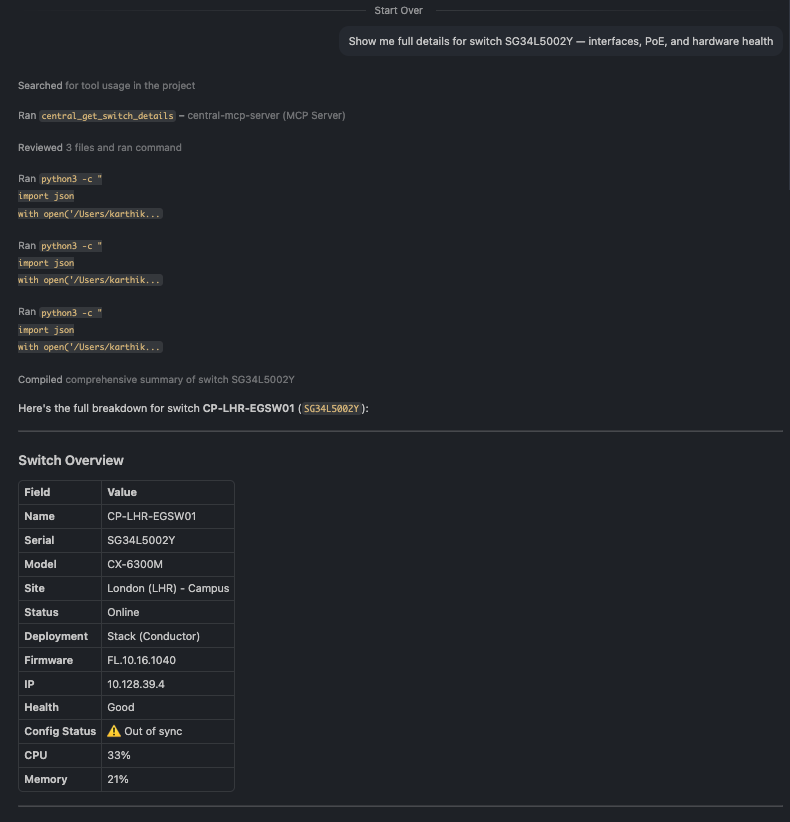
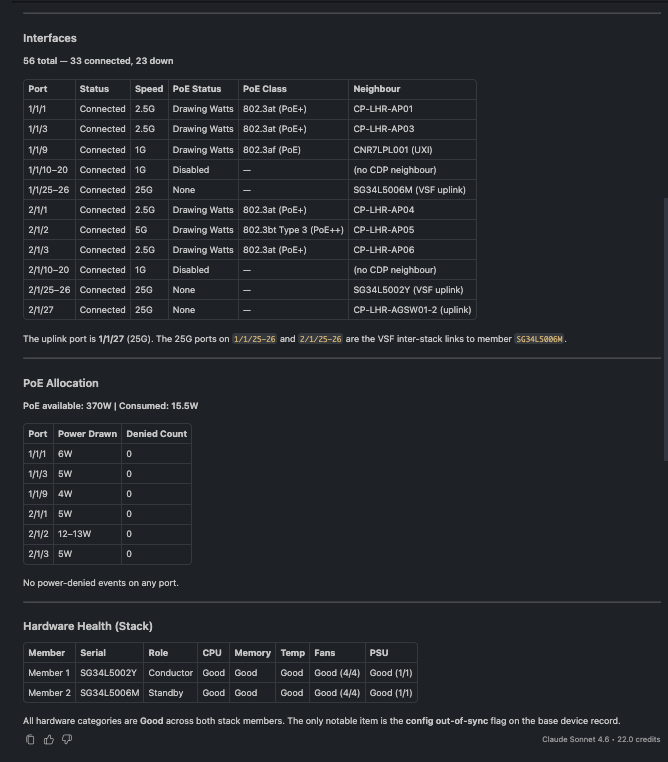
Switch detail showing interface summary, per-port PoE draw, and per-stack-member hardware health
The richest single answer in the toolset: interface summary with the uplink port and its neighbor, per-port PoE draw, and per-stack-member hardware health (CPU, memory, temperature, fans, PSUs) — all from one question.
🗨️ "List the switches at the London campus."
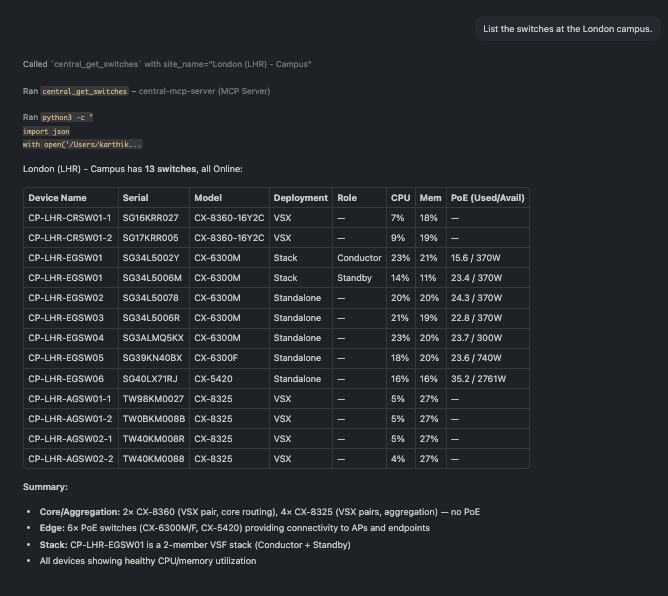
Campus switch list with model, deployment type, role, CPU, memory, and PoE
A site list that mixes standalone, stack, and VSX switches, each with a live hardware snapshot.
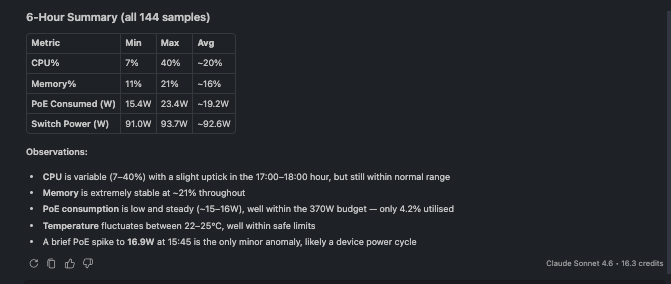
🗨️ "Show CPU, memory and PoE trends for SG34L5002Y over the last 6 hours."
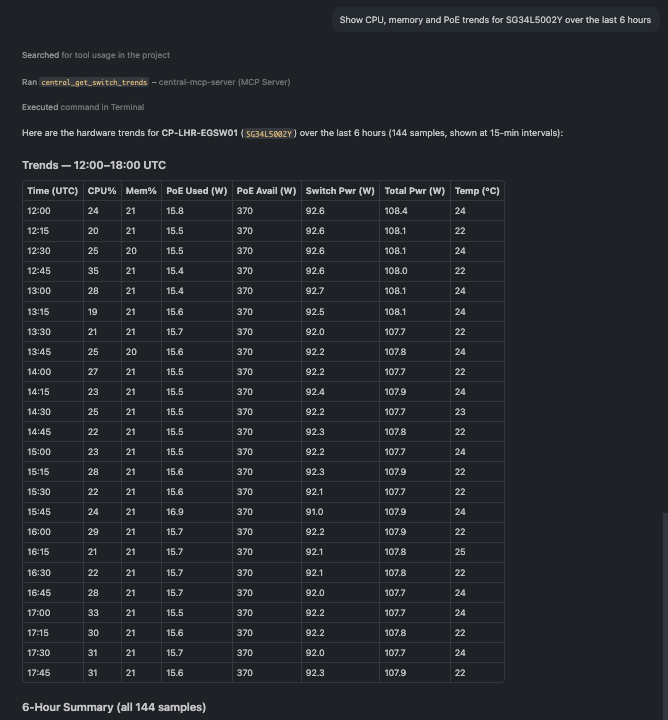
Hardware trend samples for a switch over six hours
Hardware trend samples for a switch over six hours
Hardware trends over time, CPU, memory, temperature, and PoE consumption, for capacity and heat troubleshooting. For a stack, every member is reported together.
More you can ask:
- "List all the stack switches in the network."
- "Show the VLAN table for CP-LHR-EGSW01."
- "Are there any offline switches across the network?"
- "Which London switches are running above 20% CPU right now?"
- "Show interface throughput on CP-LHR-EGSW01's uplink over the last 24 hours."
5. Gateways & Clusters
Check gateway health, cluster tunnel status, and capacity headroom — and catch a single down tunnel
buried among dozens.
Powered by the gateway monitoring tools (central_get_gateways, central_get_gateway_details, central_get_gateway_trends, central_get_gateway_cluster, central_get_cluster_capacity_trends).
🗨️ "Show me the tunnels on gateway TWSTKYH00D — are any down?"
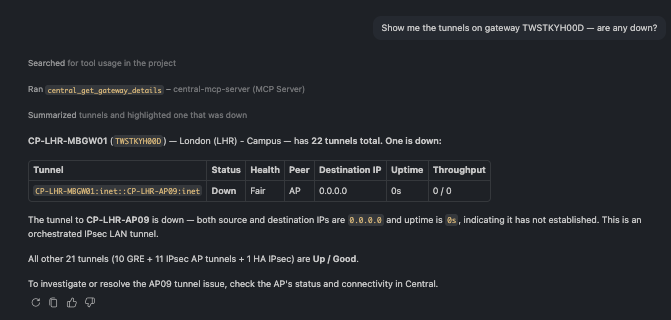
Gateway tunnel list with one tunnel highlighted as down among many healthy ones
Twenty-two tunnels, and the assistant flags the one that matters: the tunnel to CP-LHR-AP09 is down (destination 0.0.0.0, zero throughput)
🗨️ "How healthy is the CP-LHR-MBGW-CLUSTER cluster — members and tunnel health?"
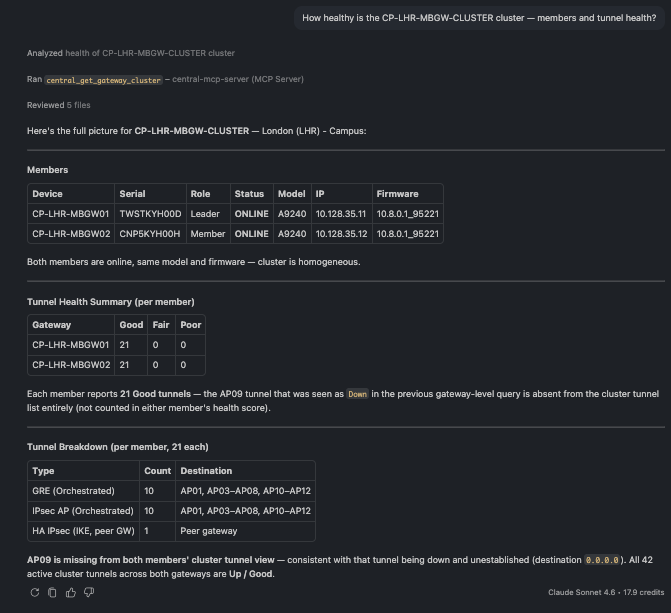
Cluster member list with per-member tunnel health counts
A cluster view: each member's role and status, its tunnel health counts (good / fair / poor), and whether any VLANs are mismatched between members.
🗨️ "Show the client capacity trend for that cluster over the last 24 hours."
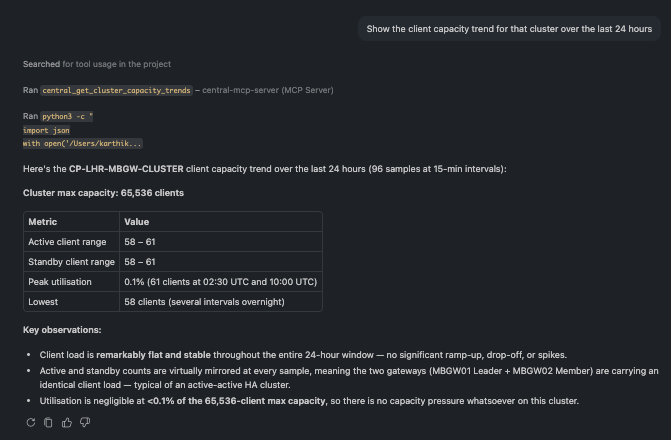
Cluster client and device capacity versus maximum over 24 hours
Capacity over time — active clients and devices against the cluster's maximum — so you know how much headroom you have before adding load.
More you can ask:
- "List the gateways at the London campus."
- "What's the CPU utilization trend on TWSTKYH00D over the last 24 hours?"
- "Are there any VLAN mismatches between the two cluster members?"
- "How many APs and switches is this cluster managing versus its maximum?"
- "Are both cluster gateways on the same firmware?"
6. Wireless / WLANs
See every SSID at a glance, inspect one, and watch its traffic over time.
Powered by the WLAN tools (central_get_wlans, central_get_wlan_stats).
🗨️ "What SSIDs are configured across the network?"
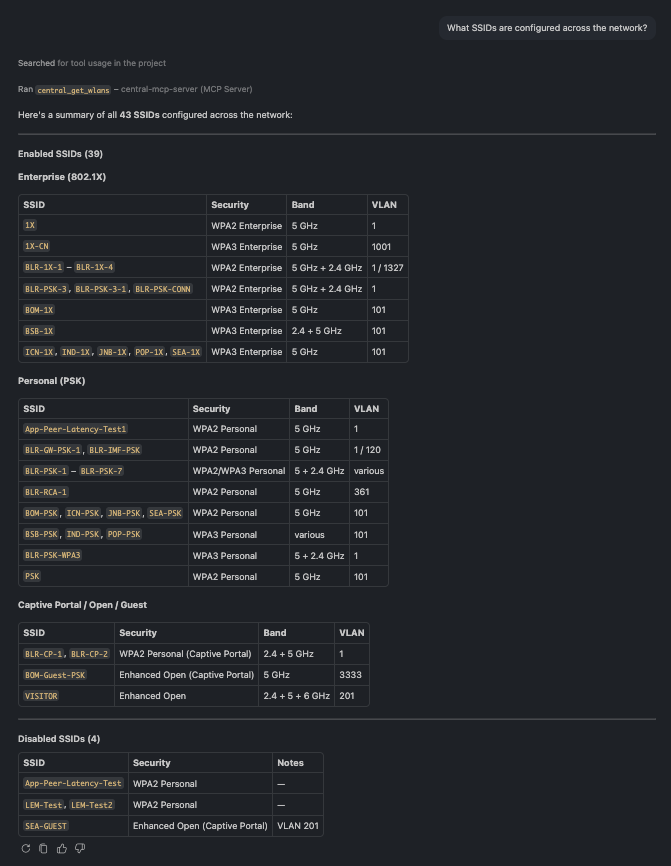
Full WLAN inventory grouped by security type
The full SSID list, grouped by security type — Enterprise, Personal, Captive Portal, and Open — so you can spot WPA3 adoption and the one guest network that runs on 6 GHz.
🗨️ "Show me details for the SSID BLR-PSK-1, and its throughput over the last 24 hours."
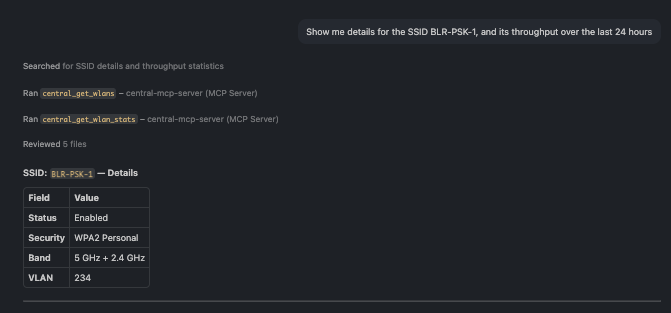
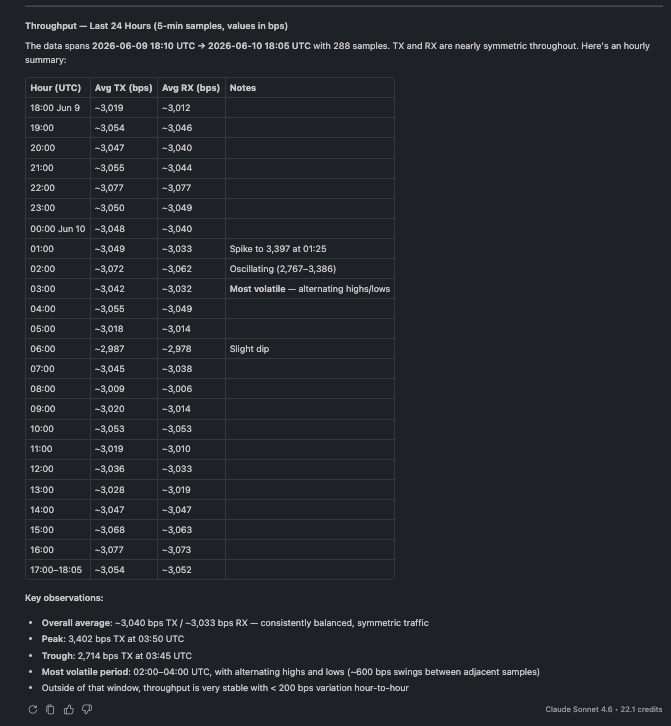
A single SSID's settings alongside its 24-hour throughput trend
Inspect one SSID — security, band, VLAN, status — and pair it with a throughput trend to see how
much traffic it actually carries.
🗨️ "Which WLANs does AP PHSXM52079 broadcast?"
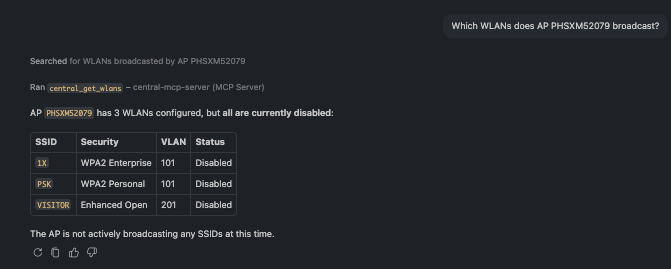
WLANs scoped to a single access point
Scope WLANs to a single AP — handy for confirming whether an AP is actually broadcasting the SSIDs you expect.
More you can ask:
- "Which SSIDs use WPA3 encryption across the network?"
- "Are there any disabled SSIDs I should know about?"
- "Show all guest or captive-portal networks and their VLANs."
- "What WLANs are available at the Bangalore site?"
- "Which SSIDs broadcast on the 6 GHz band?"
7. Clients
Find connected clients, surface failures, and pull a complete profile for any one device by MAC.
Powered by the Clients tools (central_get_clients, central_find_client).
🗨️ "Look up the client f0:b3:ec:62:aa:3d."
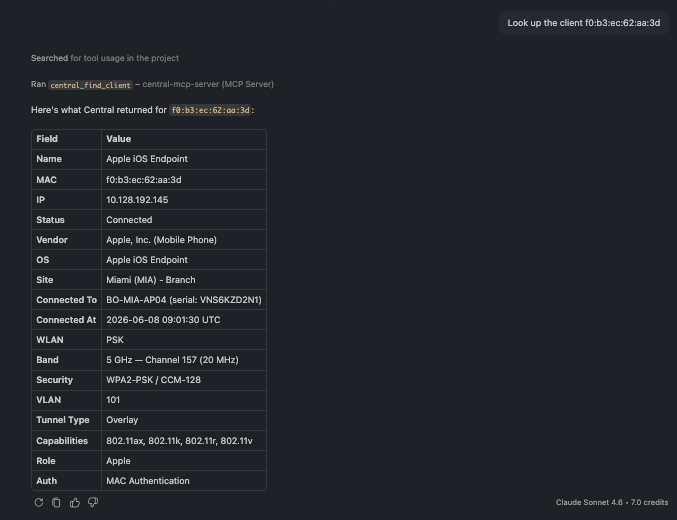
A full single-client profile including device type, AP, WLAN, band, security, and VLAN
Everything about one client in a single card — device type and OS, the AP it's on, its WLAN, band, channel, security, VLAN, capabilities, and how long it's been connected.
🗨️ "Show me the wireless clients connected at the Miami branch."
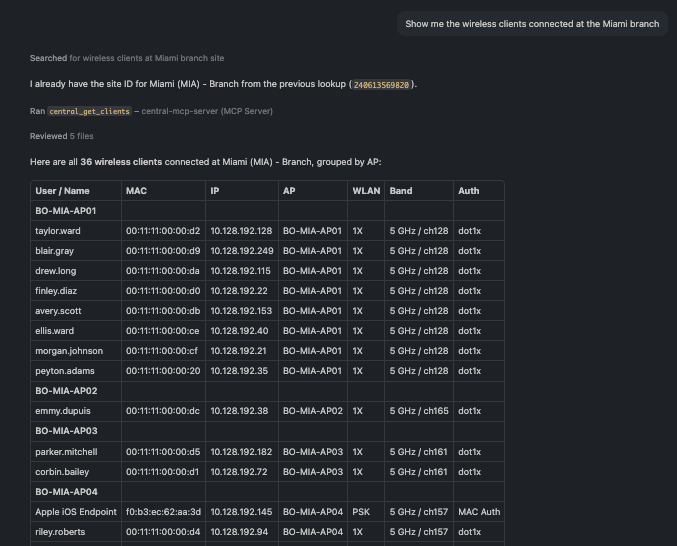
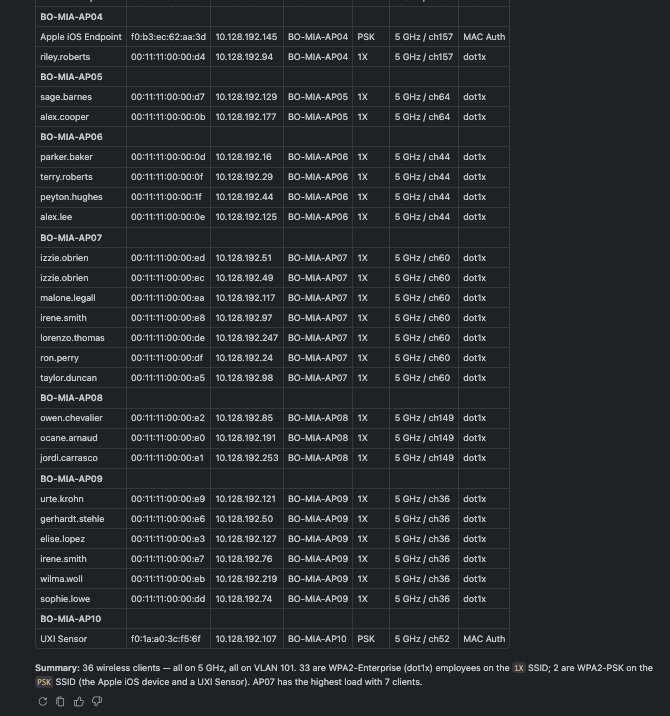
Wireless client list for a site with user, AP, WLAN, and band per client
A site's connected clients with the AP, WLAN, band, and authentication for each — a quick read on who's on the network and how.
🗨️ "Are there any failed wireless clients in Dallas site in the last 24 hours?"
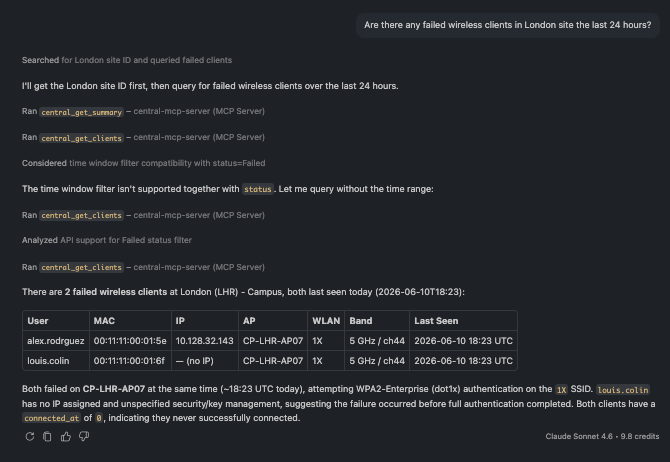
A list of failed clients across Dallas site showing the failure pattern
Surface clients that failed to connect, with the pattern behind them — here, devices stuck before getting an IP address, a classic authentication-or-association signal.
More you can ask:
- "Show me all wired clients at the Dallas campus."
- "Which clients are connected to AP BO-MIA-AP07?"
- "Are there any clients on the PSK WLAN in Miami?"
- "Show me clients on VLAN 101 at the Miami branch."
- "Find the UXI sensor at Miami by its MAC address."
8. Alerts
Triage what's actually firing — across the network or scoped to a site, sorted by severity.
Powered by the Alerts tool (central_get_alerts).
🗨️ "Show me the critical alerts at the Miami branch."
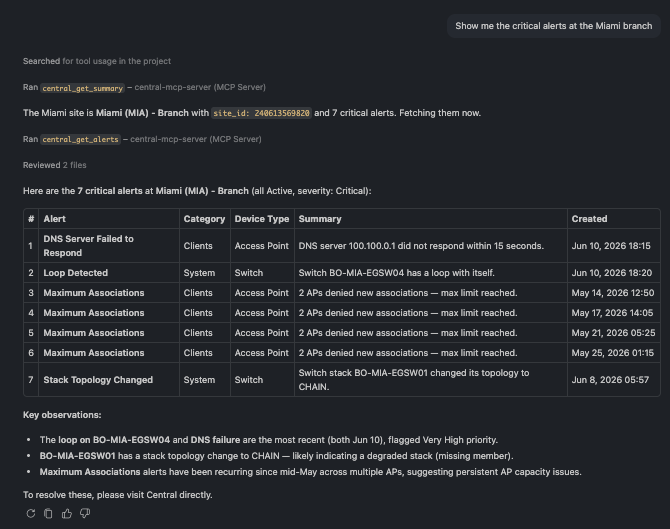
Critical alerts at a site with type, device, and time, including alerts fired today
The critical alerts at a site, newest and most severe first — here a switching loop and a DNS failure that both fired today, plus a stack-topology change. Exactly the short list you want when a site reports trouble.
🗨️ "What active alerts are at the London campus?"
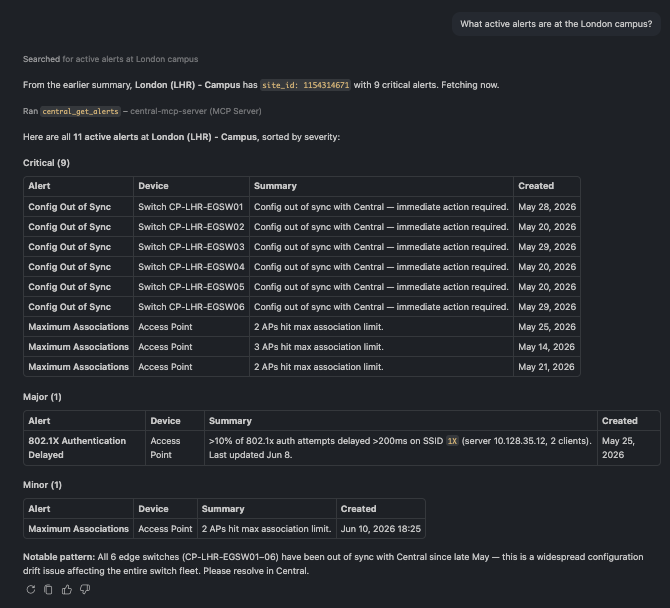
All active alerts at a site grouped by severity and device type
All active alerts for a site, grouped by severity and device type — for example, switch config drift versus AP capacity limits.
🗨️ "Break down London's alerts by category and device type."
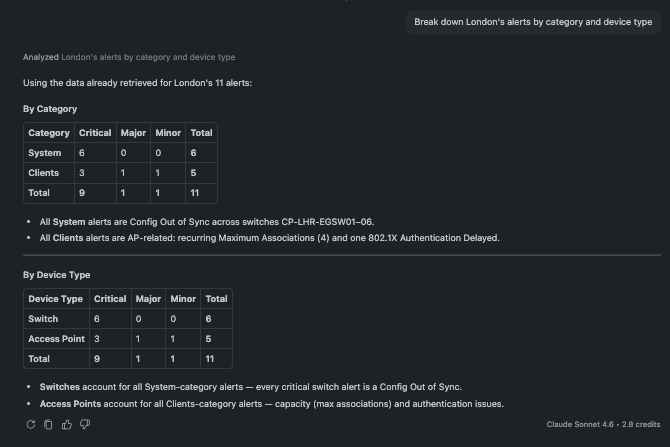
Alerts broken down by category and device type
Slice alerts by category (System, Clients, LAN, Security…) or by device type to see where the noise is concentrated.
More you can ask:
- "Are there any security alerts at Miami right now?"
- "Show me all switch alerts at Miami."
- "Have any alerts at London been cleared recently?"
- "Show me the oldest active alerts at London."
- "Are Miami's AP alerts worse than its switch alerts?"
9. Events
Survey the firehose first, then drill into a specific failure type, device, or client.
Powered by the Events tools (central_get_events_count, central_get_events).
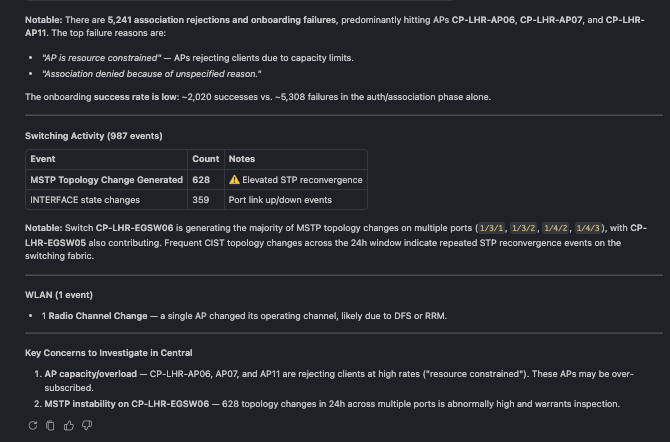
🗨️ "Summarize the events at the London campus over the last 24 hours."
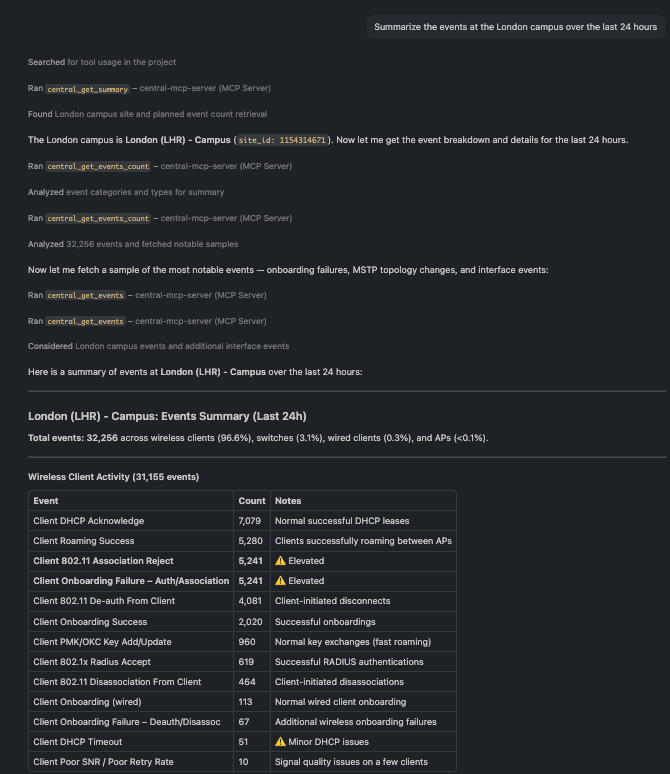
A ranked summary of event types and total count for a site over 24 hours
A site can generate tens of thousands of events a day, so start with the summary: total volume and the event types ranked by frequency. That tells you where to dig before pulling individual records.
🗨️ "Show me the recent events at the London campus."
A newest-first stream of individual events with severity and source
The detailed stream, newest first — useful once the summary points you at a pattern. Here it reveals one AP repeatedly rejecting clients because it's resource-constrained: a capacity hot-spot.
🗨️ "What events have hit switch SG34L5002Y recently?"
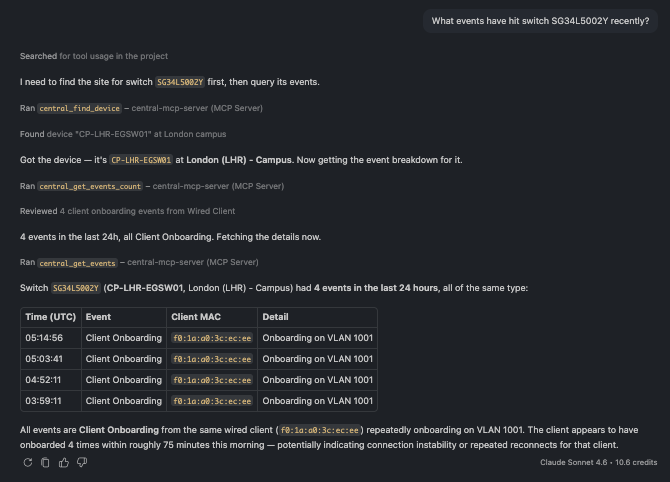
Events scoped to a single device over the last 24 hours
Scope events to one device (or client) to cut through the noise and see only what touched it.
More you can ask:
- "Which AP had the most association rejections in the last 24 hours?"
- "Show me all client onboarding failures at London in the last 6 hours."
- "List clients that had DHCP timeouts at London yesterday."
- "Were there any MSTP topology changes on the London switches today?"
- "Did any radio channel changes happen at London in the last hour?"
10. Troubleshooting & Diagnostics
Run the diagnostics a NOC engineer reaches for first — ping, traceroute, reachability checks, and
show commands — directly from the chat, against any device.
Powered by the Troubleshooting tools (central_run_network_test, central_run_show_commands, central_bounce_port).
🗨️ "Run 'show version' on switch SG38KW4011."
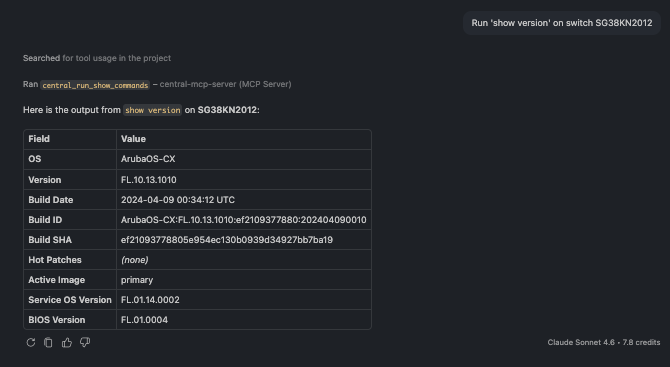
The output of a show command returned inline in the chat
A show command executed on the live switch, with its output returned right in the chat. The assistant resolves the device family from the serial number and validates the command against the device's supported catalog before running it — so a typo comes back with the list of valid commands instead of a cryptic error.
🗨️ "Ping 8.8.8.8 from switch SG38KW4011."
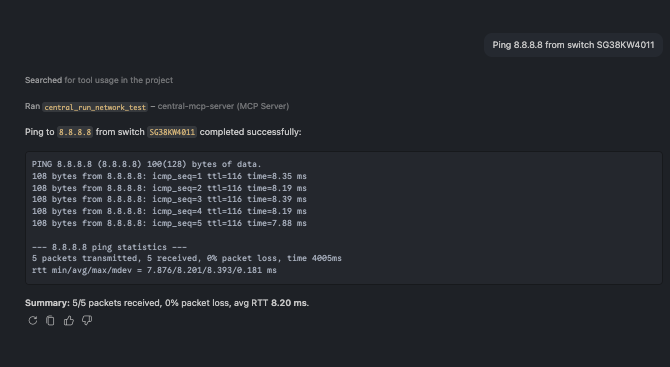
A ping result returned from a live device, surfacing a reachability problem
Live network tests — ping, traceroute, nslookup, and HTTP/HTTPS/TCP reachability — run on the device itself. Even a failure is informative: here the result cleanly surfaces that the switch has no route to the internet on that VRF, a real configuration catch rather than a tool error.
More you can ask:
- "Can BO-BLR-CX01 reach its default gateway?"
- "Traceroute from CP-LHR-EGSW01 to 1.1.1.1 to see how many hops to the internet."
- "Run 'show arp' and 'show lldp neighbors' on BO-BLR-CX01."
- "Check the spanning-tree state on the London switch."
- "Power-cycle the IP phone on port 1/1/5 without dropping the port itself."
Updated 28 days ago